

- December 8, 2022
- Posted by: Tradingshot Articles
- Category: Stock Indices
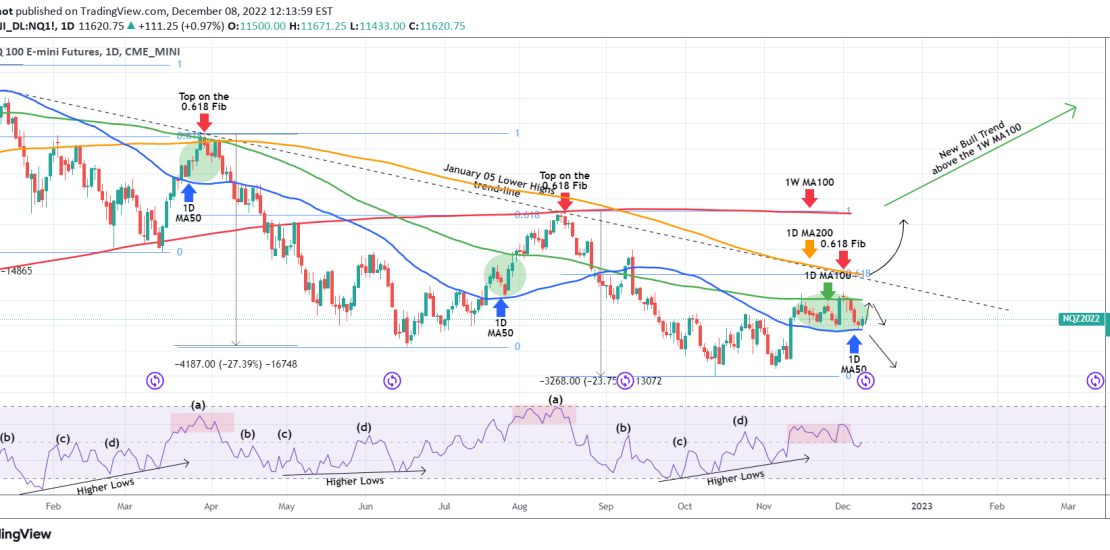
Nasdaq (NDX) has been trading sideways since November 10, with the 1D MA50 (blue trend-line) as Support and the 1D MA100 (green trend-line) as Resistance. On a wide scale, this technically looks like the previous two market tops on the January 05 Lower Highs trend-line, and the 1D RSI illustrates that clearly. However, the Jul 19 – 28 consolidation within the 1D MA50/100 zone, did make a higher extension, so it is best to stay on the sidelines until we have a clear, confirmed break-out signal.
As long as the price remains within the 1D MA50 and 1D MA100, short-term traders can scalp the range. Since the January 05 Lower Highs trend-line is getting closer and closer to the 1D MA100, there is high risk in taking a buy break-out trade there. As the 1D MA200 is unbroken since April 05, it is best to take the break-out buy if a 1D candle closes above the 1D MA200 (orange trend-line), which would be also a break above the 0.618 Fibonacci level and target the 1W MA100 (red trend-line), which would be also a test of the 13,760 August 16 High.
On the other hand, a 1D candle close below the 1D MA50, would be bearish targeting 10850 and quite possibly aiming at a new (Lower) Low.
Notice that the 0.618 Fibonacci level is a critical Resistance level as it is where Nasdaq topped both on the March 29 and August 16 Lower Highs.
Also notice that the 1W MA100 is where the August 16 High was rejected.
Tradingview link: