2022
-
GBPAUD Buy opportunity and reversal levels
- September 23, 2022
- Posted by: Tradingshot Articles
- Category: Forex
No Comments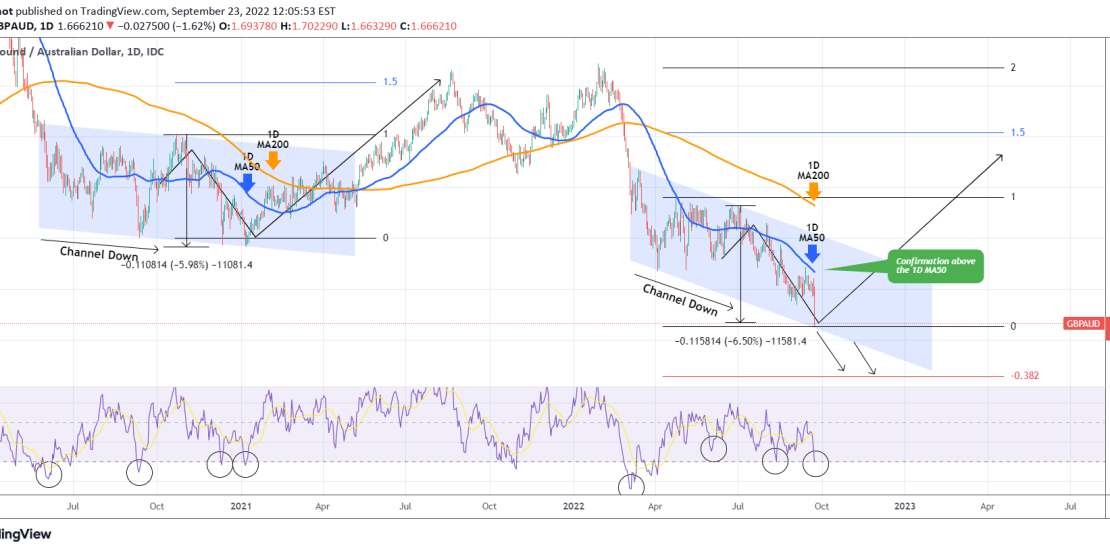
The GBPAUD pair has been trading within a Channel Down pattern since March 15. At the moment the price is on the bottom (Lower Lows trend-line) of the pattern, below both the 1D MA50 (blue trend-line) and the 1D MA200 (orange trend-line) with the 1D RSI on the 30.000 oversold level. That should be
-
AUDNZD Testing Resistance. How to trade a breakout or rejection.
- September 23, 2022
- Posted by: Tradingshot Articles
- Category: Forex
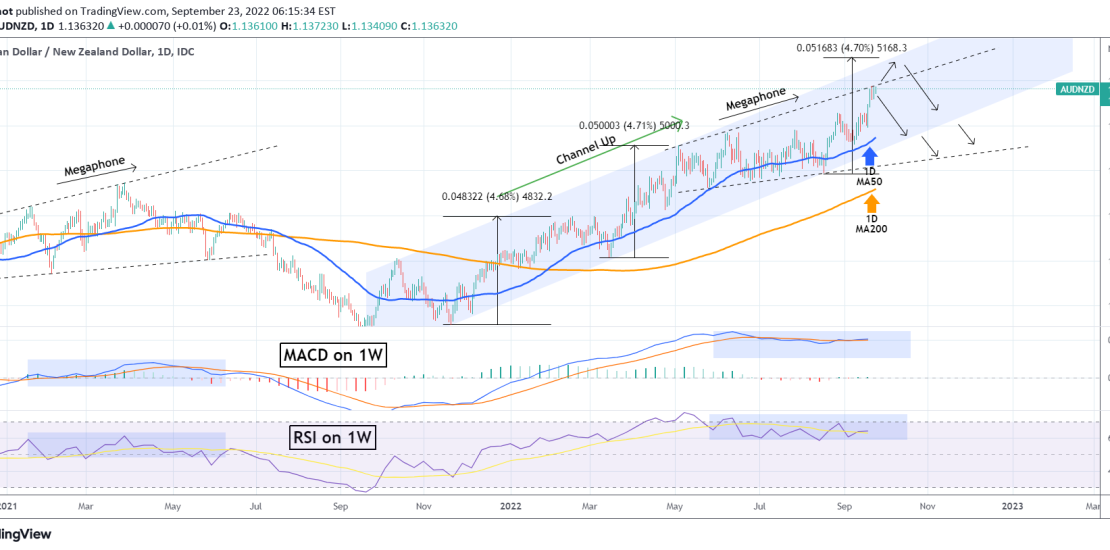
The AUDNZD pair has been on a strong structured uptrend since September 16 2021 market low, within a long-term Channel Up. Recently, the pattern turned into a Bullish Megaphone according to the 1W RSI and MACD indicators, much like the one that started on January 2021. The price is currently testing the top (Higher
-
NZDJPY Rebound on the 1D MA200 or break to pre-March levels?
- September 22, 2022
- Posted by: Tradingshot Articles
- Category: Forex
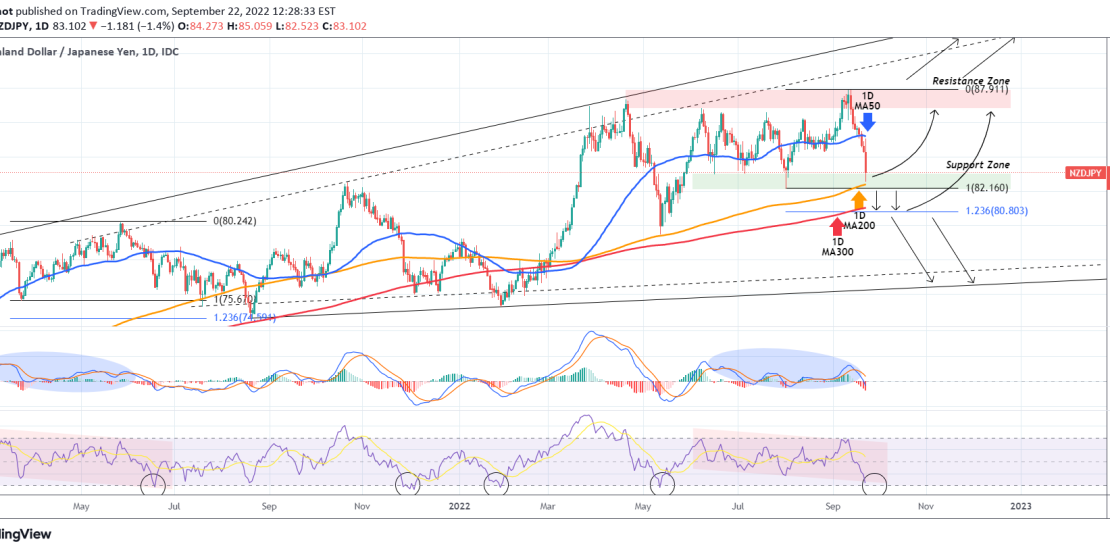
The NZDJPY pair has had a massive rejection today on the 1D MA50 (blue trend-line) as the forex market is attempting to digest yesterday’s Fed Rate Hike by 0.75 bp for the 3rd straight meeting. The sell-off almost hit and is so far holding the 1D MA200 (orange trend-line), which has been holding since
-
EURUSD How will it react to the Fed’s 3rd straight 0.75% Hike?
- September 22, 2022
- Posted by: Tradingshot Articles
- Category: Forex
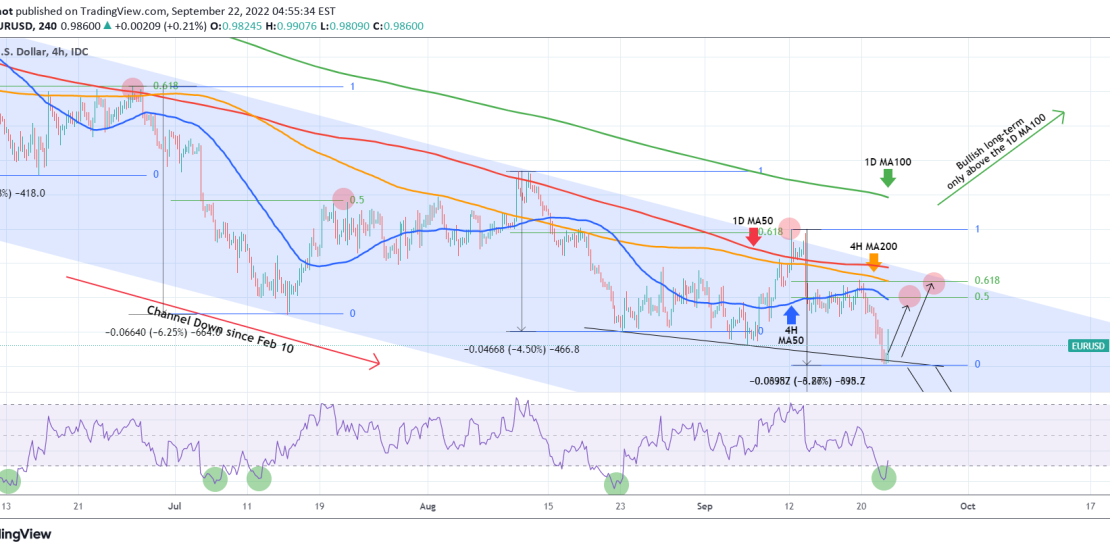
The EURUSD pair is rebounding on the current 4H candle, following the rejection after the Fed raised the Interest Rate again by 0.75% for the 3rd straight meeting. So far this rebound seems to be technical as the 4H RSI hit the oversold level (green circles) that it has another 4 times in the
-
S&P500 How to trade it following the 0.75% Rate Hike
- September 22, 2022
- Posted by: Tradingshot Articles
- Category: Stock Indices
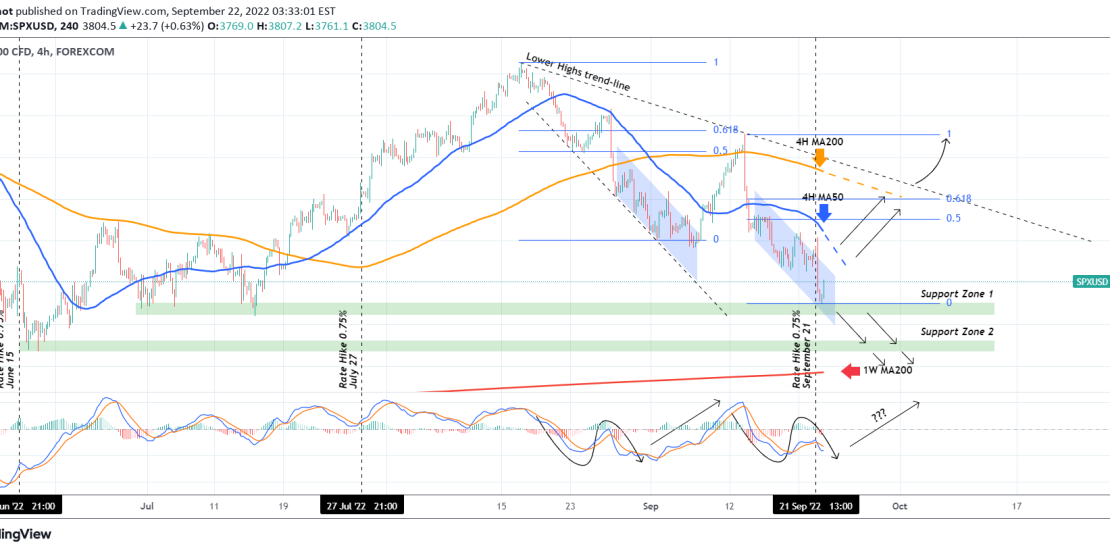
The S&P500 index (SPX) dipped aggressively following yesterday’s Fed Rate Decision, which was a natural reaction to the third straight 0.75% rate hike. The first one was made on Jun 15 2022 (rate gone from 1.00% up to 1.75%) and the second on July 27 2022 (rate gone from 1.75% to 2.50%). In both
-
BITCOIN Do we have a clear recovery pattern based on pastCycles?
- September 21, 2022
- Posted by: Tradingshot Articles
- Category: Cryptocurrency
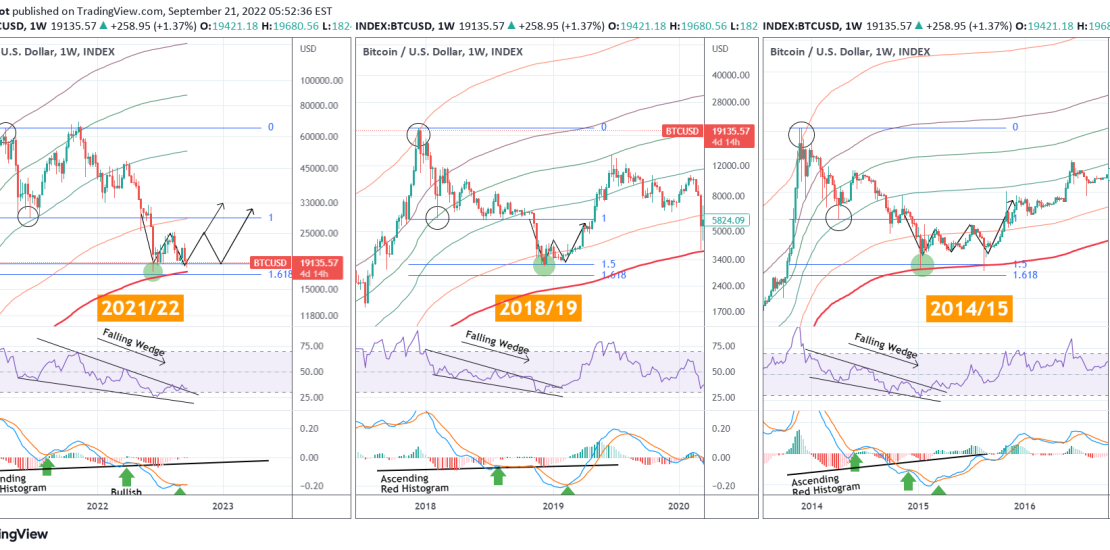
Just as we are waiting for today’s Fed Rate Decision, Bitcoin (BTCUSD) remains low, in fact it is the closest it has been to June’s Low with the 1W MA300 (bold red trend-line) approaching from below. Is this the last selling before a bottom is formed. One way to look at it is by
-
XCNUSDT Falling Wedge about to break. How to trade it.
- September 21, 2022
- Posted by: Tradingshot Articles
- Category: Cryptocurrency
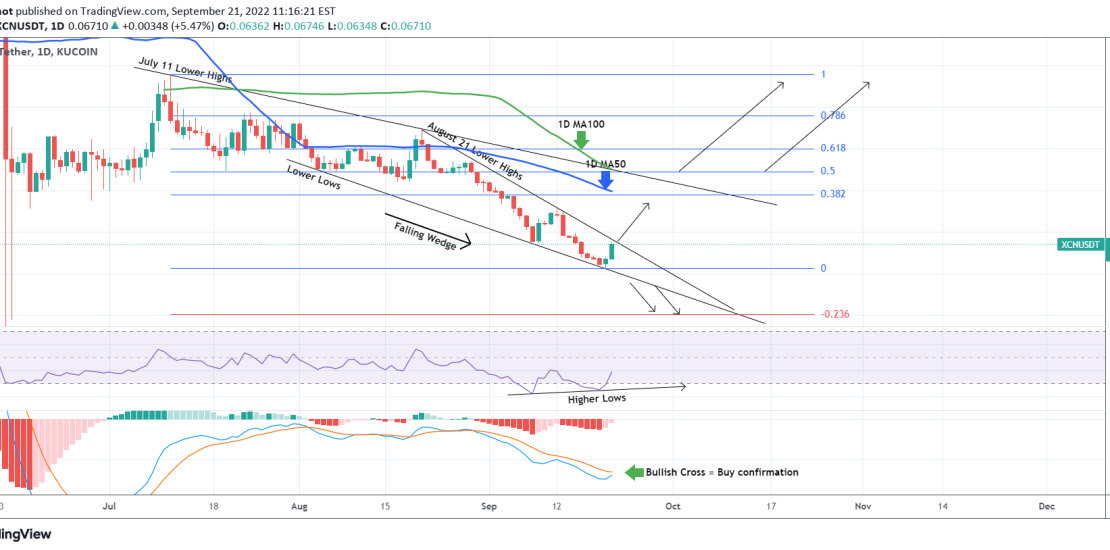
*** *** For this particular analysis on Chain we are using the XCNUSDT symbol on the KuCoin exchange. *** *** The idea is on the 1D time-frame where XCN has been trading within a Falling Wedge pattern since the August 04 Low. As you see the pattern has reached a level where it is
-
CADJPY Sell-opportunity on a long-term rising trend.
- September 20, 2022
- Posted by: Tradingshot Articles
- Category: Forex
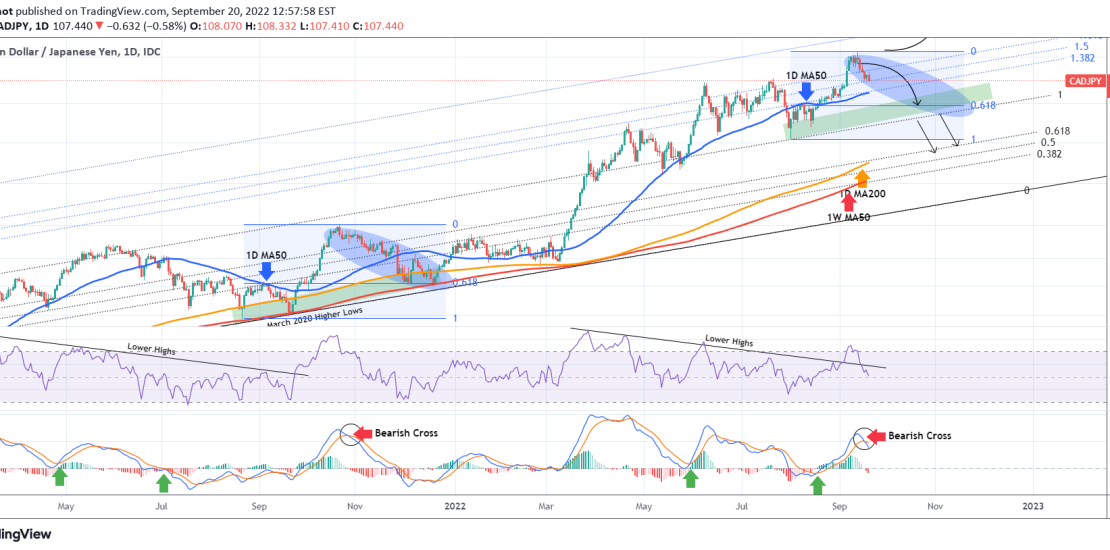
The CADJPY pair has been on a (very) long-term rising trend as depicted by the Fibonacci Channel on this chart, since the March 2020 market low. At the moment we see a short-term pull-back after the price made a new Higher High since the April 21 one. Based both on the RSI and MACD
-
AUDCAD Still bearish unless this level breaks
- September 20, 2022
- Posted by: Tradingshot Articles
- Category: Forex
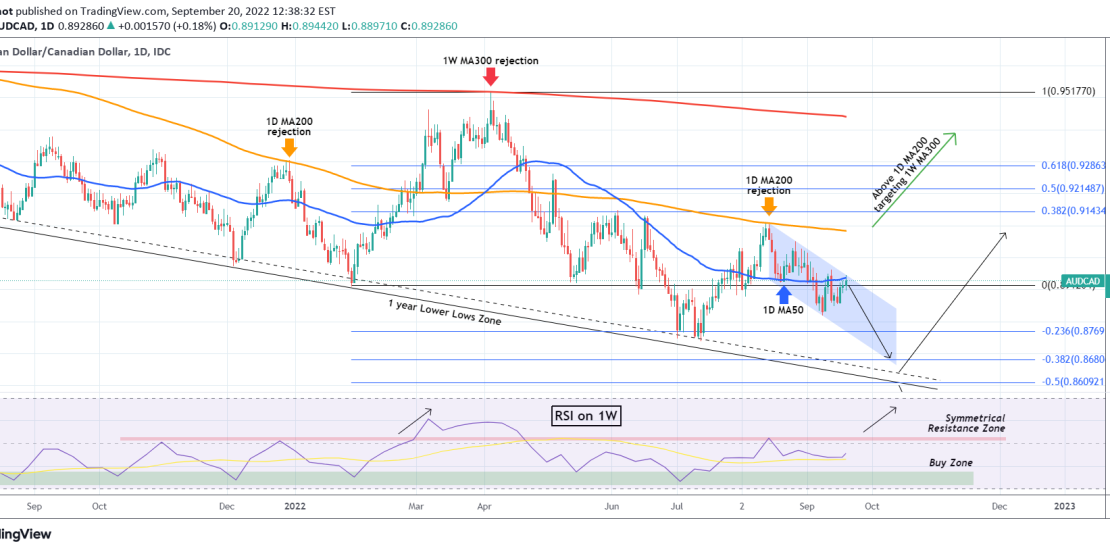
The AUDCAD pair is following our trading plan to the point since our last analysis (August 12), which was a sell signal following the 1D MA200 (orange trend-line) rejection: As you see nothing has changed, the price got emphatically rejected on the 1D MA200 and entered a Channel Down that has already hit our
-
EURUSD Still neutral. Best to trade the break-outs.
- September 19, 2022
- Posted by: Tradingshot Articles
- Category: Forex
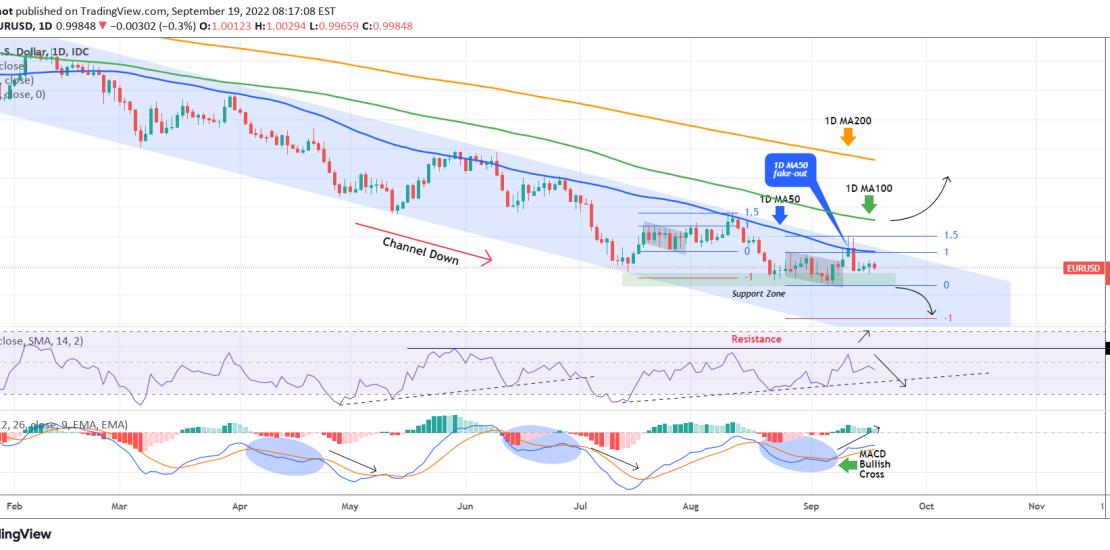
Following our previous EURUSD analysis, the pair is exactly as we left it, neutral within the 0.98650 Support (of the September 06 Low) and the top (Lower Highs trend-line) of the 8-month Channel Down. The September 12 break above the 1D MA50 (blue trend-line), proved to be a fake-out as the price failed to

