

- September 20, 2022
- Posted by: Tradingshot Articles
- Category: Forex
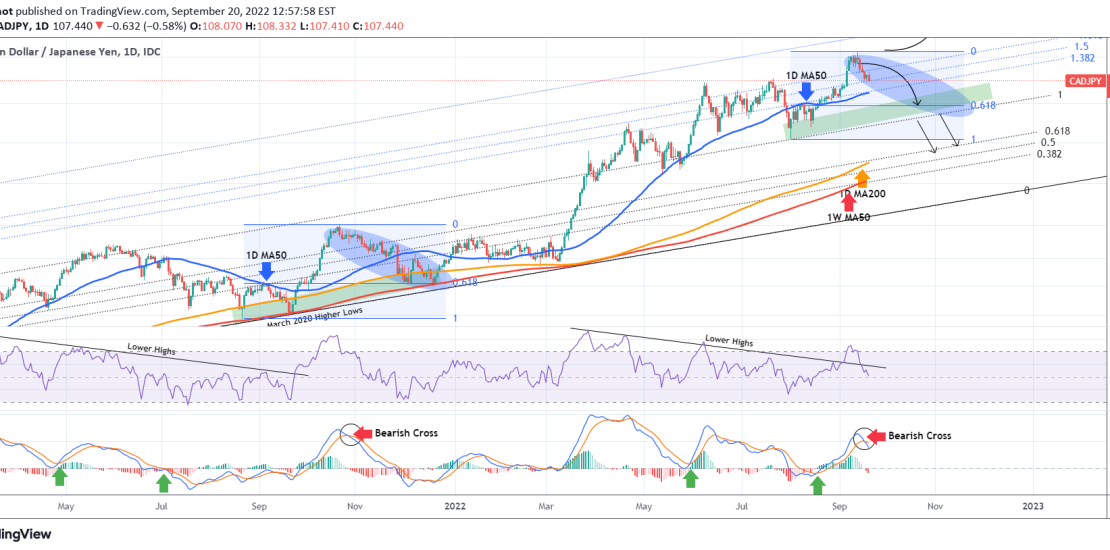
The CADJPY pair has been on a (very) long-term rising trend as depicted by the Fibonacci Channel on this chart, since the March 2020 market low. At the moment we see a short-term pull-back after the price made a new Higher High since the April 21 one.
Based both on the RSI and MACD indicators, it appears that we are in a similar pull-back leg as the one that started on October 21 2021. As you see the MACD was on a Bearish Cross with the RSI dropping after previously breaking a Lower Highs trend-line.
That sequence found bottom on the 0.618 Fibonacci retracement level. On the current pattern that level is at 104.810 and that is our target on the short-term. This is invalidated if we break above the 110.630 Resistance, in which case we will take it as a buy break-out signal, targeting the 2.0 Fibonacci extension of the Channel. Further selling can be made if the price breaks below the 1.0 Channel Fib, in which case we would expect it to reach the 1D MA200/ 1W MA50 (orange and red trend-lines respectively) Support Zone.
Tradingview link: