

- September 21, 2022
- Posted by: Tradingshot Articles
- Category: Cryptocurrency
*** ***
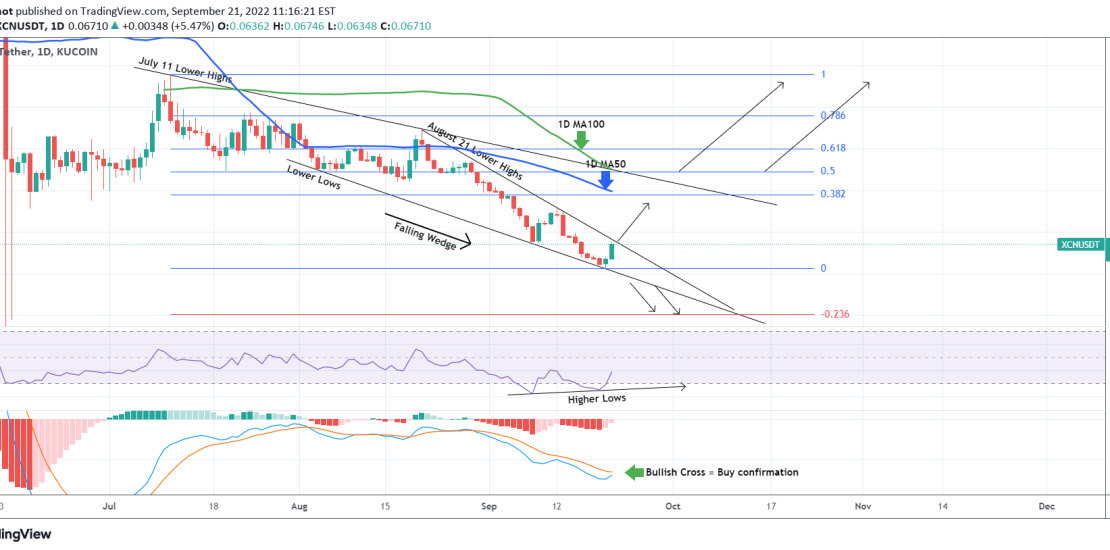
For this particular analysis on Chain we are using the XCNUSDT symbol on the KuCoin exchange.
*** ***
The idea is on the 1D time-frame where XCN has been trading within a Falling Wedge pattern since the August 04 Low. As you see the pattern has reached a level where it is too narrow at eventually will break out. In the event of an upwards break-out, the target should be the 1D MA50 (blue trend-line) and the 0.382 Fibonacci retracement level. Above the 1D MA100 (green trend-line) and the 0.5 Fib, we can consider a buy extension.
In the event of a break-out downwards, the target could be the -0.236 Fibonacci extension level. Note that the 1D RSI has been on Higher Lows since September 08 while the candle action was on Lower Lows, showcasing a bullish divergence. That can potentially mean that we have to give the upside a slight edge. The ideal confirmation may be once the 1D MACD forms a Bullish Cross.
Tradingview link: