

2022 September
-
EURJPY Buy opportunity upon a pull-back.
- September 14, 2022
- Posted by: Tradingshot Articles
- Category: Forex
No Comments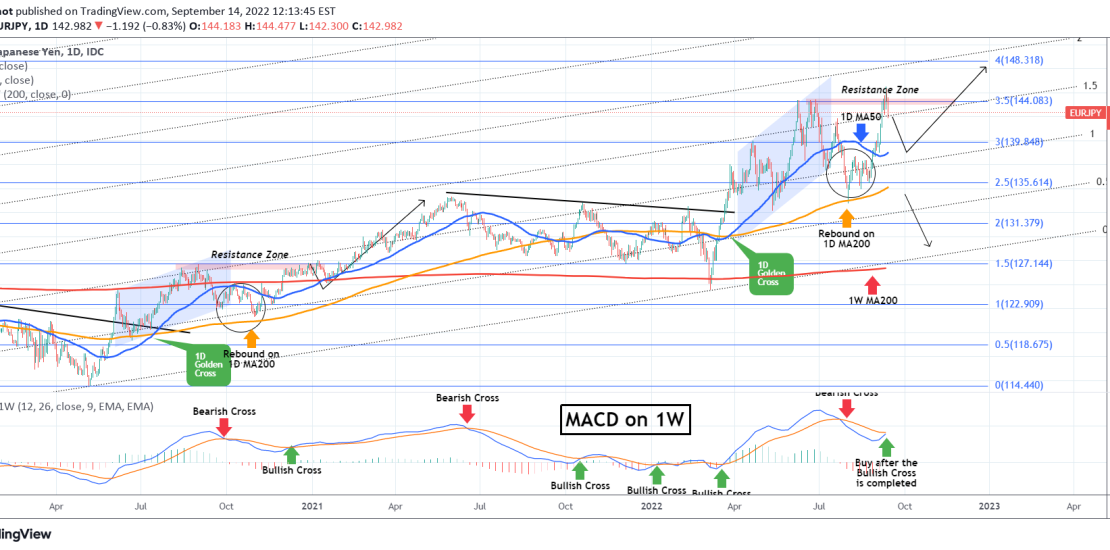
The EURJPY pair is pulling back currently after marginally breaking above the June Resistance Zone. This continues to repeat the fractal of 2020 as we pointed out in our last analysis: As you see the projection was correct as the price rebounded exactly on the 1D MA200 (orange trend-line) just like on November 02
-
ETHBTC Bearish Cross on MACD
- September 13, 2022
- Posted by: Tradingshot Articles
- Category: Cryptocurrency
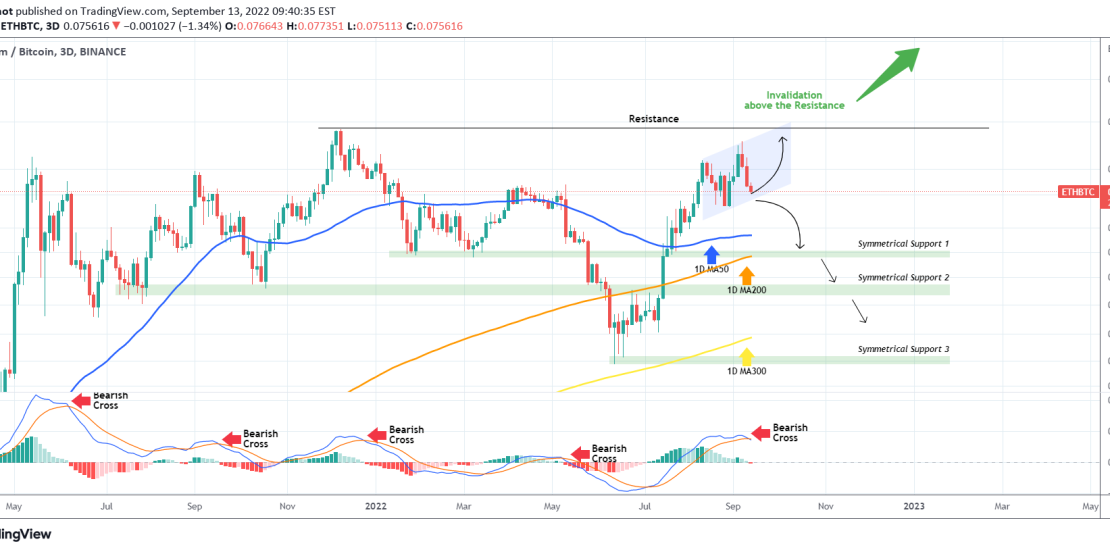
This is yet another chart on the 3D time-frame, which time after time has proved to be reliable in catching medium-term price trends. This time on the ETHBTC pair, the 3D MACD just formed a Bearish Cross. As you see, since the June 06 2021 candle (so more than a year), every such formation
-
XAGUSD Hit the 1D MA50. Major break-out possible!
- September 12, 2022
- Posted by: Tradingshot Articles
- Category: Commodities
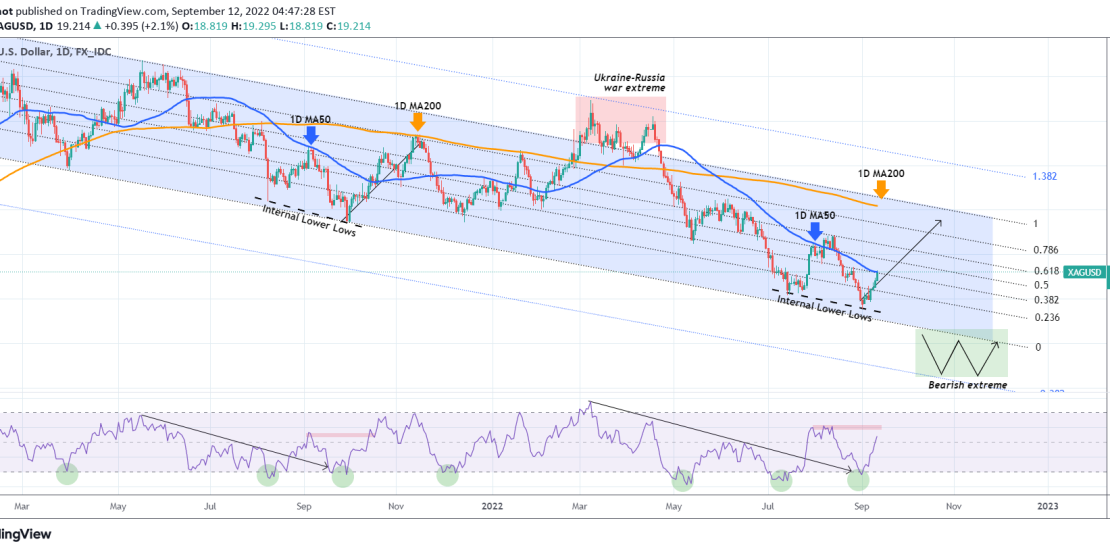
Silver (XAGUSD) hit today its 1D MA50 (blue trend-line) for the first time in 4 weeks (since Aug 17). It did so after rebounding on an Internal Lower Lows trend-line similar to that of August 09 – September 29 2021. This is basically the formation that emerged within the 1.5 year long-term Channel Down
-
EURUSD Breaking above the 7-month Channel Down.
- September 12, 2022
- Posted by: Tradingshot Articles
- Category: Forex
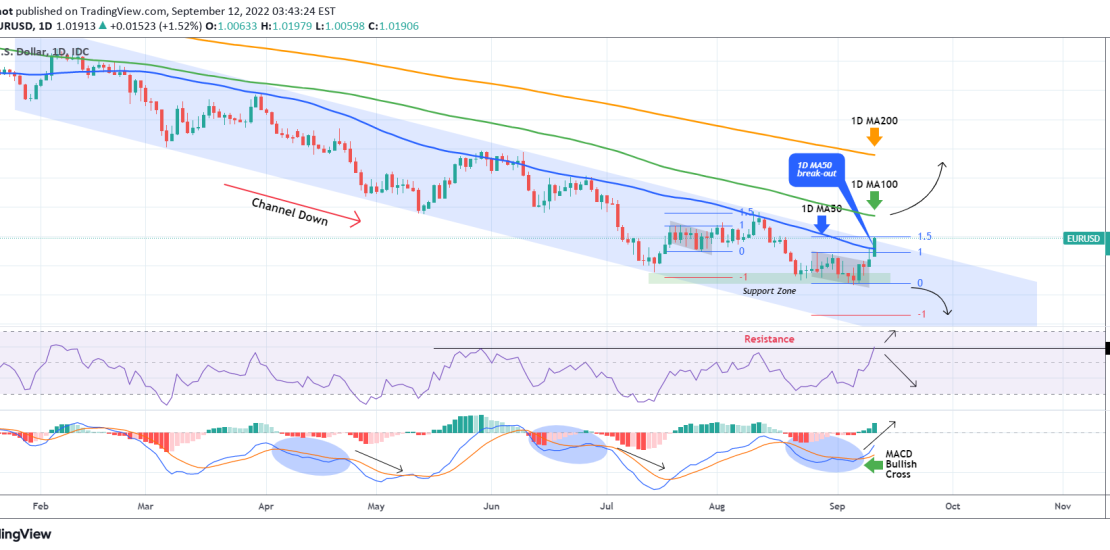
The EURUSD pair did as expected following our last analysis and as it held the 0.98700 Support, it rose aggressively and reached the 1.5 Fibonacci extension just like on the August 10 fractal: This time we are back to the 1D time-frame again as we have a much more important development in front of
-
ETCUSD Channel Down or Bull Flag? See how to trade it!
- September 8, 2022
- Posted by: Tradingshot Articles
- Category: Cryptocurrency
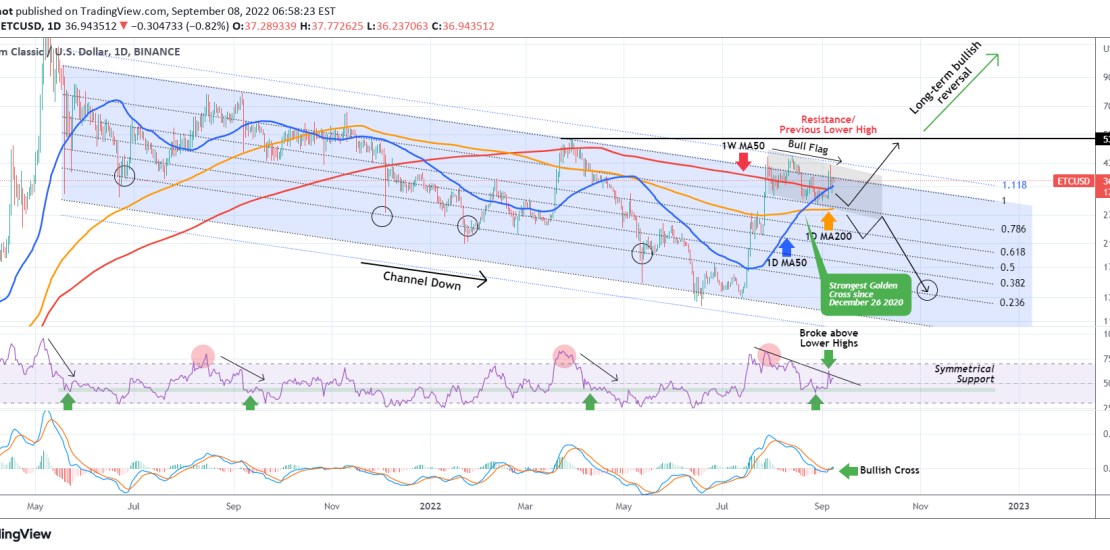
Ethereum Classic (ETCUSD) has been trading within a Channel Down on the medium-term, since the July 29 High. This has come after an enormous and very quick +250% rise on fundamentals, since the July 13 Low. The overall trend since the May 2021 market high has been bearish inside a Channel Down pattern. You
-
LUNCUSDT What to watch out on the short-term
- September 8, 2022
- Posted by: Tradingshot Articles
- Category: Cryptocurrency
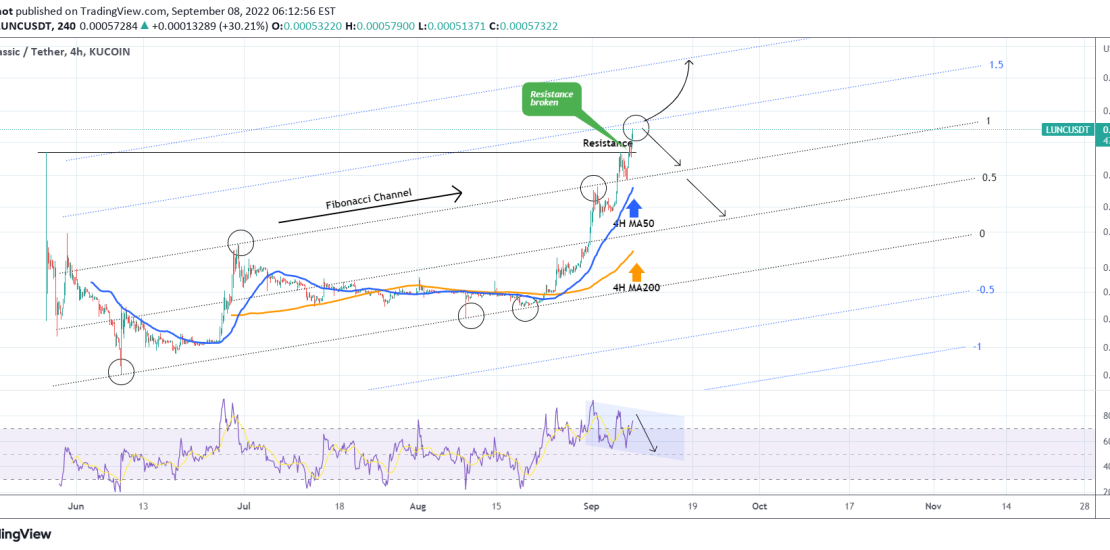
*** *** For this particular analysis on Terra Classic we are using the LUNCUSDT symbol on the KuCoin exchange. *** *** The idea is on the 4H time-frame where LUNC is extending the parabolic rise it has been on since the August 19 Low. As we mentioned in our previous analysis the break-out above
-
USDZAR Critical Resistance. Levels to buy and sell.
- September 6, 2022
- Posted by: Tradingshot Articles
- Category: Forex
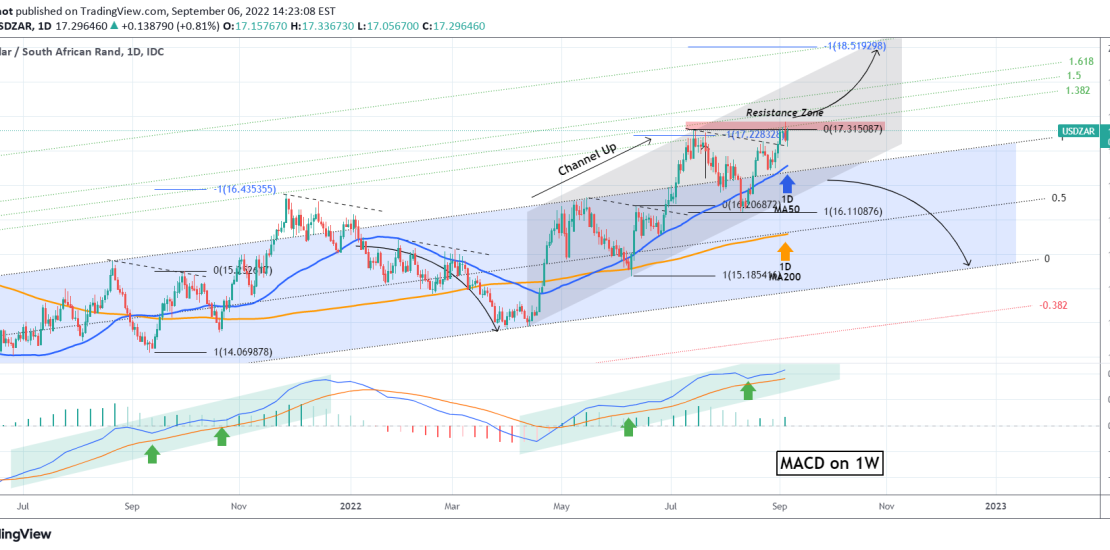
The USDZAR pair broke above its former Resistance Zone since our last analysis on June 29: The 1.382 Fibonacci extension target was hit and yet another break-out approach turned out to be successful. With the 1D MA50 (blue trend-line) supporting since August 17, we will continue to adopt a break-out trading perspective. A 1D
-
S&P500 These market dynamics show we’re not in a Bear Market yet
- September 6, 2022
- Posted by: Tradingshot Articles
- Category: Stock Indices
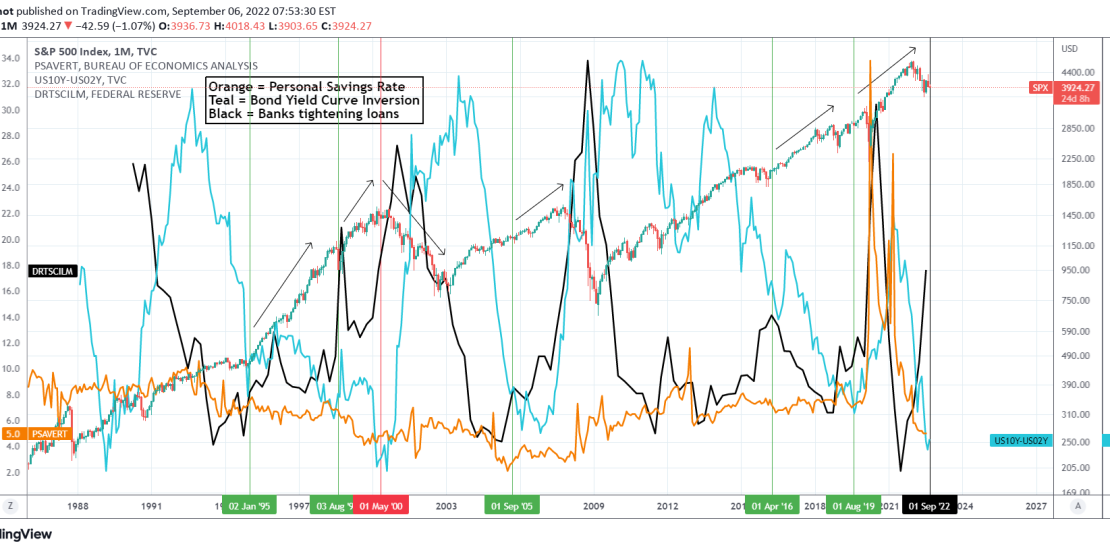
This is a cross asset technical analysis on the S&P500 Index (SPX) on the 1M (monthly) time-frame. The symbols included are the Personal Savings Rate (orange trend-line), the Yield Curve Inversion (teal trend-line) and the % of Domestic Banks tightening (black trend-line). ** Personal Savings ** A little background info on what each symbol
-
EURUSD Neutral within this zone. Consider those break-out levels
- September 6, 2022
- Posted by: Tradingshot Articles
- Category: Forex
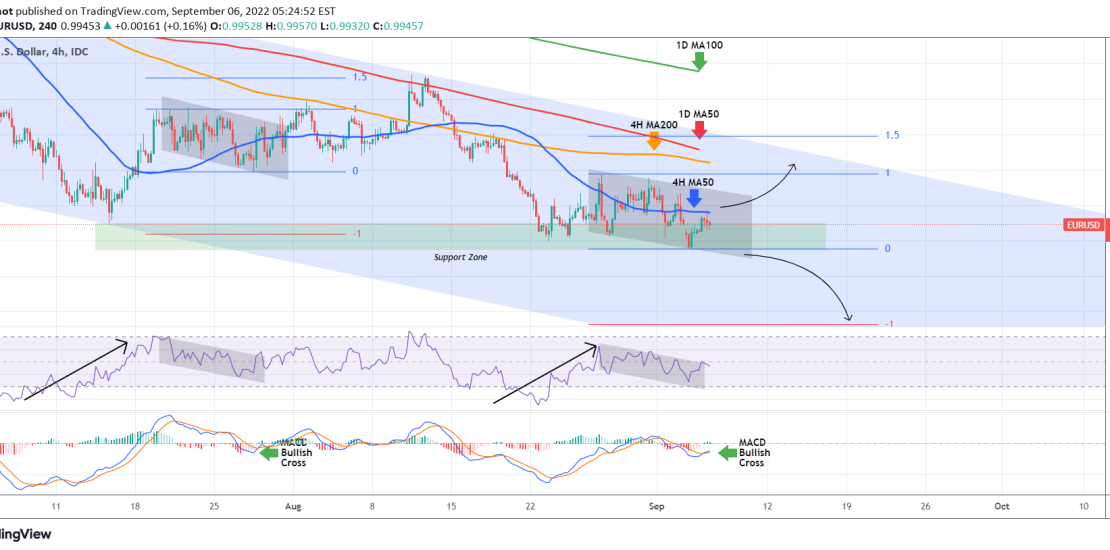
The EURUSD pair got rejected today on the 4H MA50 (blue trend-line) after attempting to make a rebound within the 1.5 month Support Zone. The RSI and MACD patterns on the 4H time-frame are similar to the Bull Flag formation of July 19 – 27, where the RSI was inside a Channel Down and
-
DOW JONES on the 2008 crash fractal and how it avoids it.
- September 2, 2022
- Posted by: Tradingshot Articles
- Category: Stock Indices
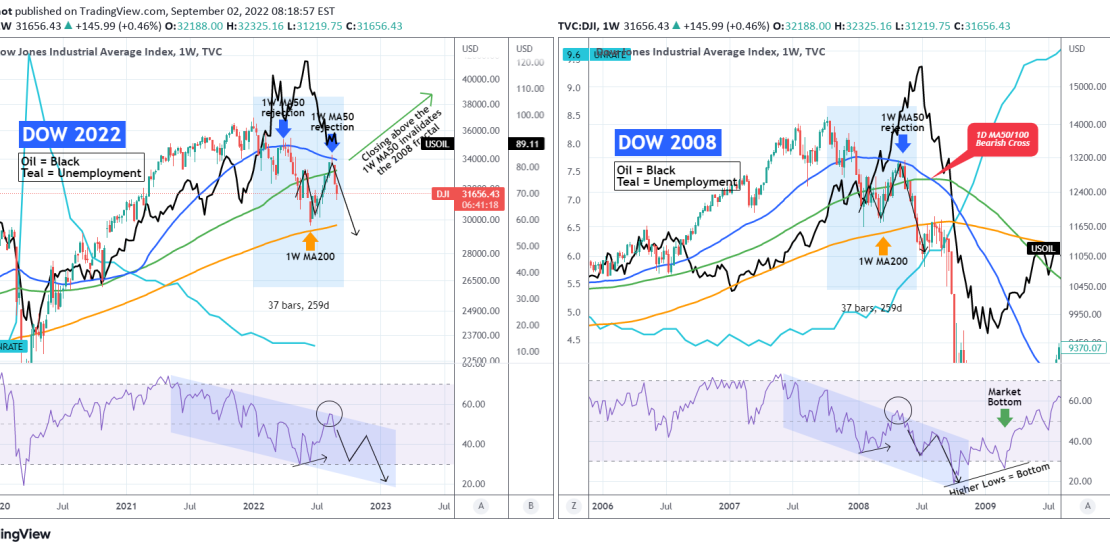
I’ve made many comparisons of Dow Jones’ (DJI) 2022 Bearish Price Action with past Bear Cycles but being near closing its 3rd straight red 1W (weekly) candle since the August 15 rejection on the 1W MA50 (blue trend-line), it is time to update it. As you see, this is a comparison of Dow’s 2021/2022