

- September 12, 2022
- Posted by: Tradingshot Articles
- Category: Commodities
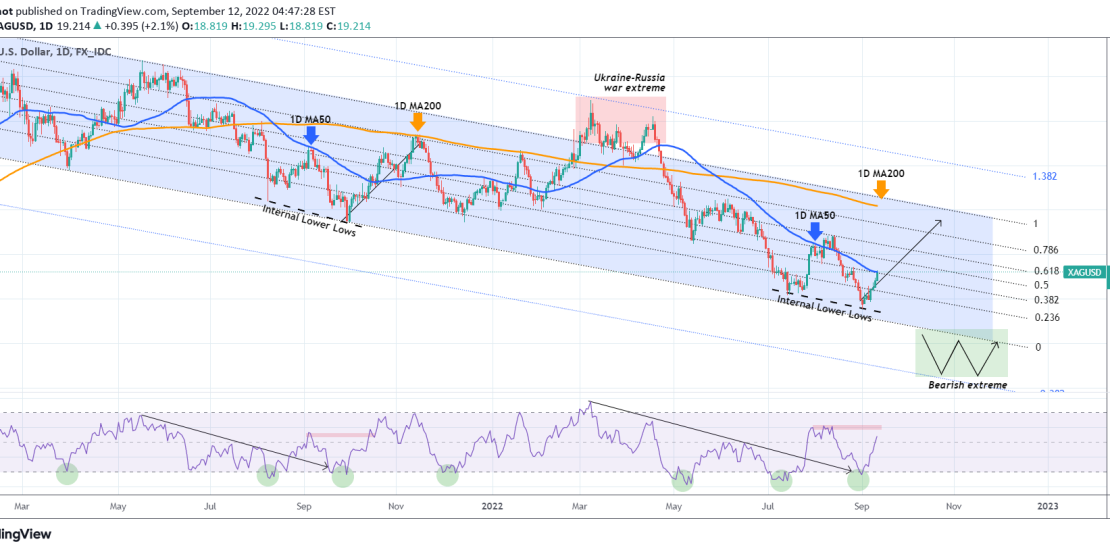
Silver (XAGUSD) hit today its 1D MA50 (blue trend-line) for the first time in 4 weeks (since Aug 17). It did so after rebounding on an Internal Lower Lows trend-line similar to that of August 09 – September 29 2021. This is basically the formation that emerged within the 1.5 year long-term Channel Down pattern that has been dominating the bearish trend since the February 01 2021 market high.
The Aug-Sep 2021 fractal rebounded after hitting the Internal Lower Lows and following the 1D MA50 break-out, it hit the 1D MA200 (orange trend-line) on the 0.786 Channel Fib retracement. Notice that both fractals made the 1D MA50 test on the 0.382 Fib. The 1D RSI patterns among the two are also similar. As a result, if the price closes above the 1D MA50, we will target the 1D MA200 or the 0.786 Fib (whichever comes first, most likely th 0.786 Fib will).
We are only willing to short if the price closes below the Channel Down and target the Bearish Extreme of -0.382, just like the Bullish Extreme of the March 2022 Russia – Ukraine war, targeted the 1.382 Fibonacci extension.
Tradingview link:
https://www.tradingview.com/chart/XAGUSD/BSplgW2m-XAGUSD-Hit-the-1D-MA50-Major-break-out-possible