

- September 13, 2022
- Posted by: Tradingshot Articles
- Category: Cryptocurrency
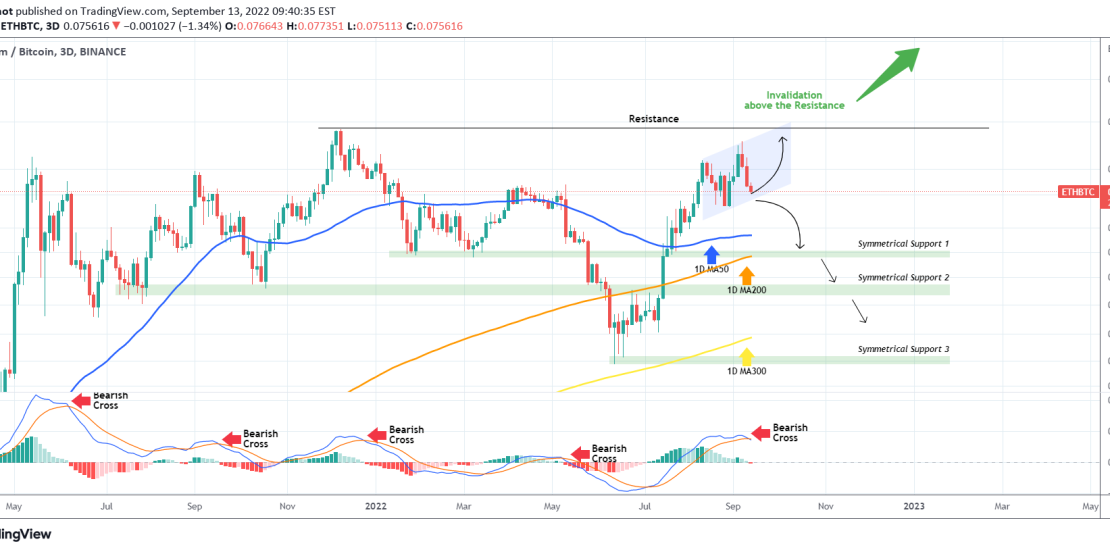
This is yet another chart on the 3D time-frame, which time after time has proved to be reliable in catching medium-term price trends. This time on the ETHBTC pair, the 3D MACD just formed a Bearish Cross. As you see, since the June 06 2021 candle (so more than a year), every such formation (with the exception of August 20 2021) was a sell signal. I have pointed out key Support zones with the first one being around 0.06500.
Since the pair has been on a Channel Up patten since mid August and the price is now too close to its bottom (Higher Lows trend-line), it is worth attempting a tight SL buy but reverse to a sell if the price breaks below the Channel. On the longer-term, the Bearish Cross effect will be invalidated if the pair breaks above its 0.088640 Resistance (previous market High).
Tradingview link:
https://www.tradingview.com/chart/ETHBTC/jvnUeHUl-ETHBTC-Bearish-Cross-on-MACD