

- September 12, 2022
- Posted by: Tradingshot Articles
- Category: Forex
The EURUSD pair did as expected following our last analysis and as it held the 0.98700 Support, it rose aggressively and reached the 1.5 Fibonacci extension just like on the August 10 fractal:

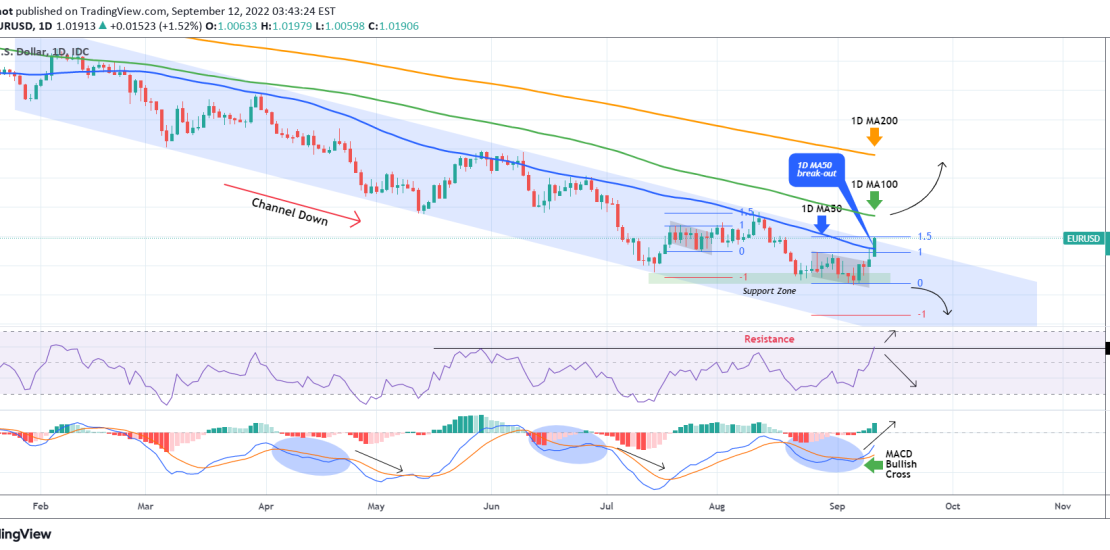
This time we are back to the 1D time-frame again as we have a much more important development in front of us. The price didn’t just break above the 1D MA50 (blue trend-line) today but also above the Channel Down pattern that has been dominating the bearish trend for the past 7 months. We need a candle closing above it to confirm that, but still, the 1D RSI breaking above its May 30 Resistance and the 1D MACD turning upwards on a Bullish Cross, invalidating the April 25 and July 01 bearish fractals, are an early indication that we may have a major bullish break-out ahead of us.
In order for that to technically take place though, we ideally want to see a break above the 1D MA100 (green trend-line), which has been intact as a Resistance since February 11. A break above that line, would be a bullish break-out signal, targeting the 1D MA200 (orange trend-line). On the other hand, we are willing to sell again only if a 1D candle closes below the 0.98700 Support, in which case we’ll target the -1.0 Fibonacci extension (0.96620). The area between those two break-out points is considered as neutral by us.
Tradingview link:
https://www.tradingview.com/chart/EURUSD/L2URkab3-EURUSD-Breaking-above-the-7-month-Channel-Down