

- September 6, 2022
- Posted by: Tradingshot Articles
- Category: Forex
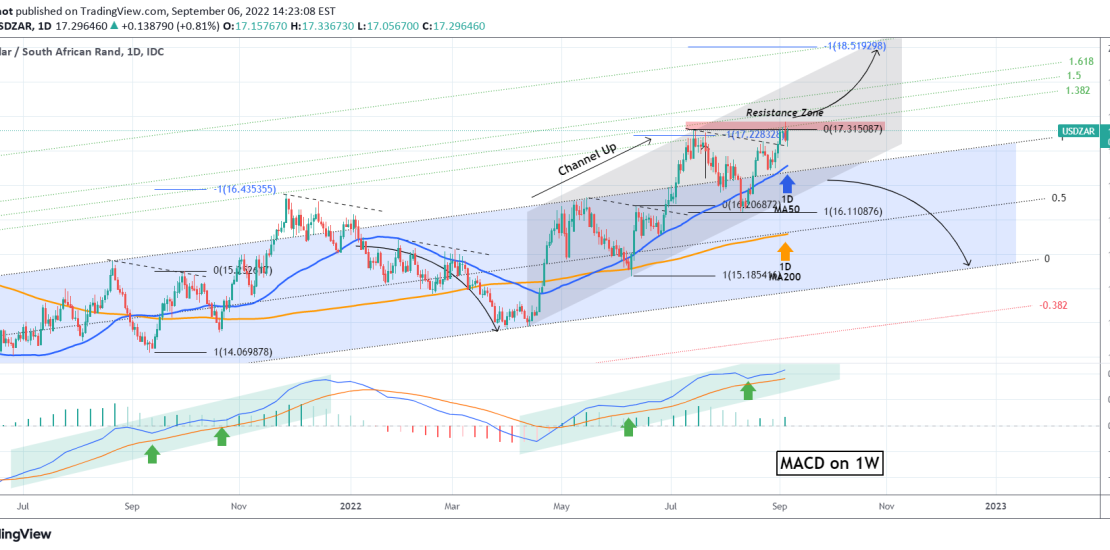
The USDZAR pair broke above its former Resistance Zone since our last analysis on June 29:

The 1.382 Fibonacci extension target was hit and yet another break-out approach turned out to be successful. With the 1D MA50 (blue trend-line) supporting since August 17, we will continue to adopt a break-out trading perspective. A 1D candle close above the 17.4400 High, will be a break-out buy signal yet again, targeting the -1.0 Fibonacci extension, which happens to be on the 2.0 Fib of the Channel. As you see, after every High break-out, the pair has always reached (or came close to) the -1.0 Fib ext.
On the other hand, a break below the Channel Up that started after the April 12 Low, will be a sell break-out signal towards the 0.0 Fib level, i.e. the bottom of the long-term Channel.
See how the MACD on the 1W time-frame remains bullish, having a sequence similar to that of June – November 2021.
Tradingview link:
https://www.tradingview.com/chart/USDZAR/dMUBuL0T-USDZAR-Critical-Resistance-Levels-to-buy-and-sell