

2022 June
-
USDCAD Buy opportunity and counter trade if invalidated
- June 9, 2022
- Posted by: Tradingshot Articles
- Category: Forex
No Comments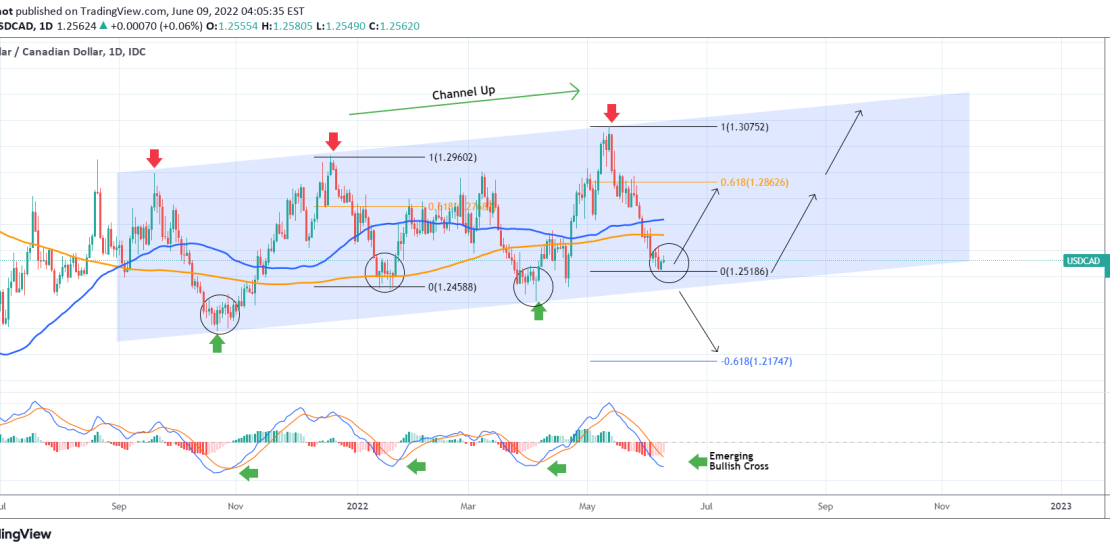
The USDCAD pair has been trading within a Channel Up since last September (2021). So far it has had three clear Higher Highs and two Higher Lows. Right now the price is very close to that Higher Lows (bottom) trend-line of the pattern and when the 1D MACD makes a Bullish Cross, it will
-
GBPUSD Sell as long as it fails on the 1D MA50
- June 9, 2022
- Posted by: Tradingshot Articles
- Category: Forex

The GBPUSD pair has hit our Target of the previous analysis, breaking in the process that Bearish Megaphone pattern to the downside: Right now a new Bearish Megaphone has been formed with the price trading sideways near the 1D MA50 (blue trend-line) after failing to break it on the May 27 High. Basically the
-
S&P500 The 1D MA50 is resisting. Scenarios ahead.
- June 8, 2022
- Posted by: Tradingshot Articles
- Category: Stock Indices
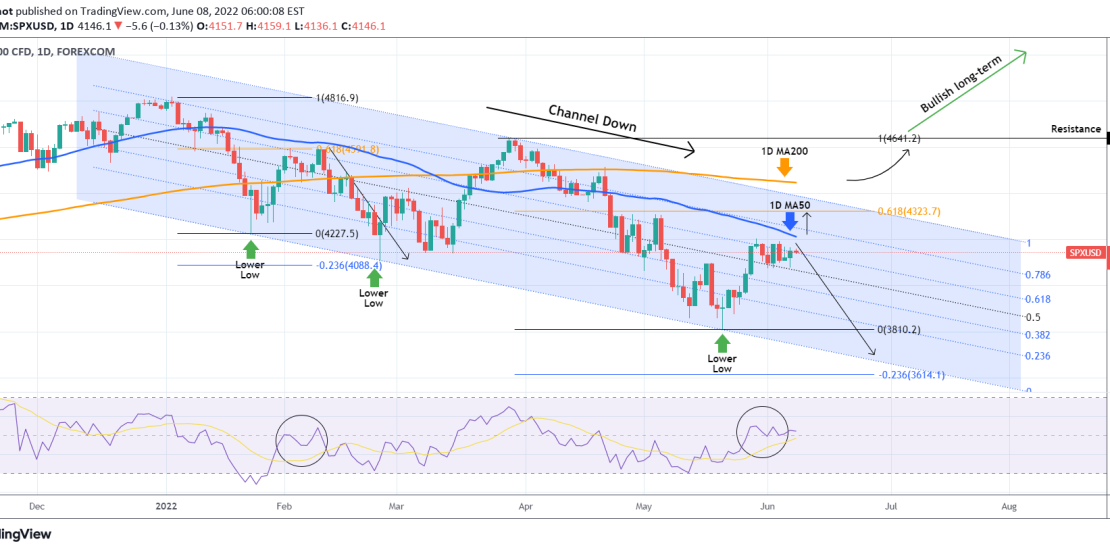
The S&P500 index (SPX) rose rapidly and almost hit its 1D MA50 (blue trend-line), which is the current Resistance, since our last post: The long-term pattern remains a Channel Down since the All Time Highs (ATH), so the trend remains bearish towards the 3810 Support and quite possibly the -0.236 Fibonacci extension as a
-
XLMUSDT Failing to break the 1D MA50.
- June 7, 2022
- Posted by: Tradingshot Articles
- Category: Cryptocurrency

*** *** For this particular analysis on STELLAR we are using the XLMUSDT symbol on the Phemex exchange. *** *** The idea is on the 1D time-frame where Stellar Lumen has been consolidating since its May 31 short-term High, which is still a Lower High within the Channel Down pattern that started in November
-
NASDAQ Sideways but still off the top of the Channel Down
- June 6, 2022
- Posted by: Tradingshot Articles
- Category: Stock Indices
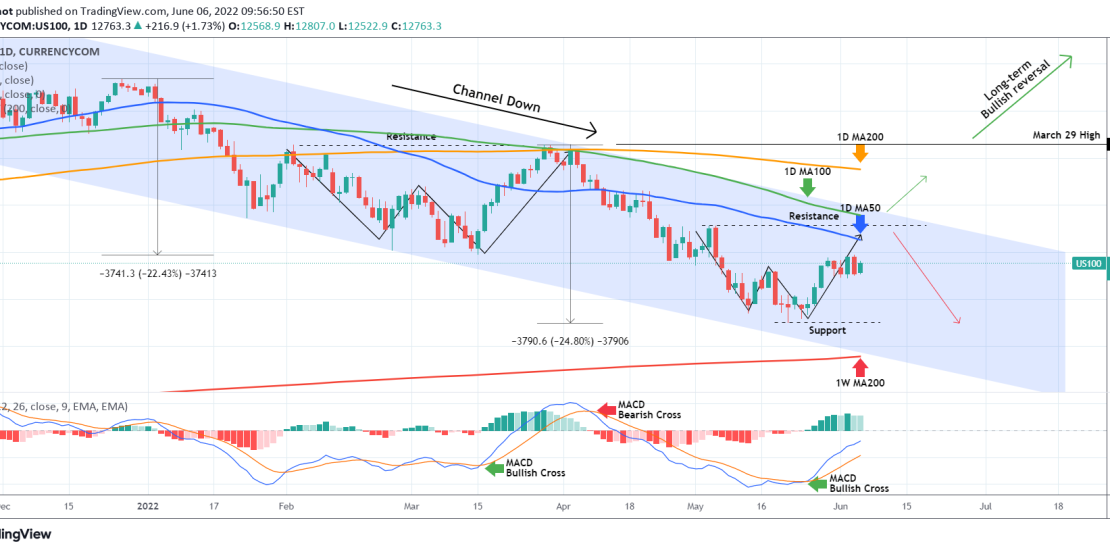
Nasdaq (NDX) has been trading sideways since May 30. The 1D MA50 (blue trend-line) is right above with the 1D MA100 (green trend-line) being roughly around the Lower Highs (top) trend-line of the Channel Down. Based on our previous analysis 2 weeks ago, the index was on a W pattern aiming at the Resistance
-
DOW JONES Consolidating below the 1D MA50 for a week
- June 6, 2022
- Posted by: Tradingshot Articles
- Category: Stock Indices
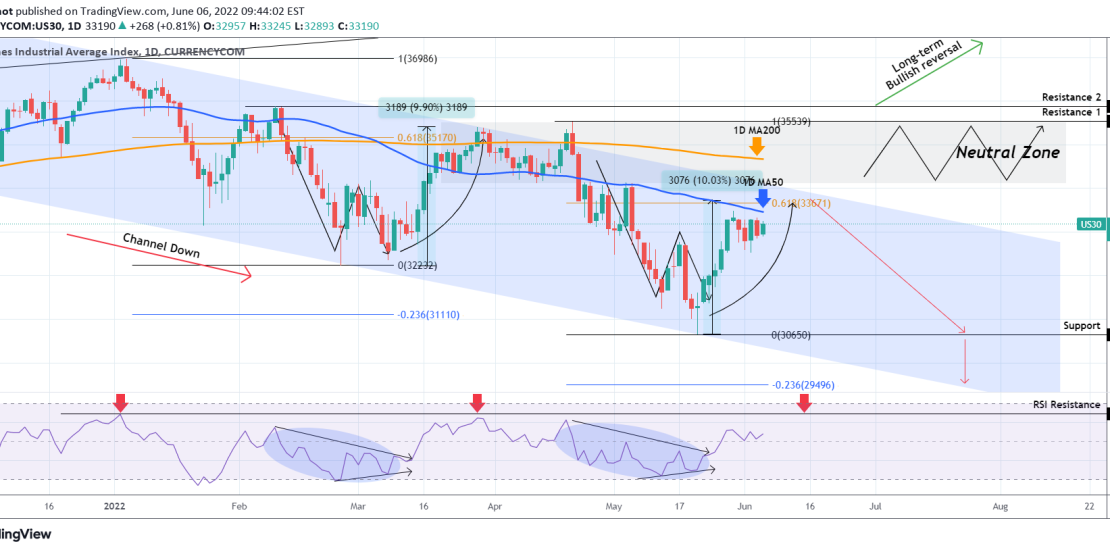
Dow Jones (DJI) eventually rebounded at the bottom (Lower Lows trend-line) of its long-term Channel Down, since our last analysis that indicated a sold R/R ratio for going long: Since the end of May though, the index has failed just before a 1D MA50 (blue trend-line) test and turned sideways below that level. This
-
XAUUSD Still bearish unless this level breaks
- June 6, 2022
- Posted by: Tradingshot Articles
- Category: Commodities
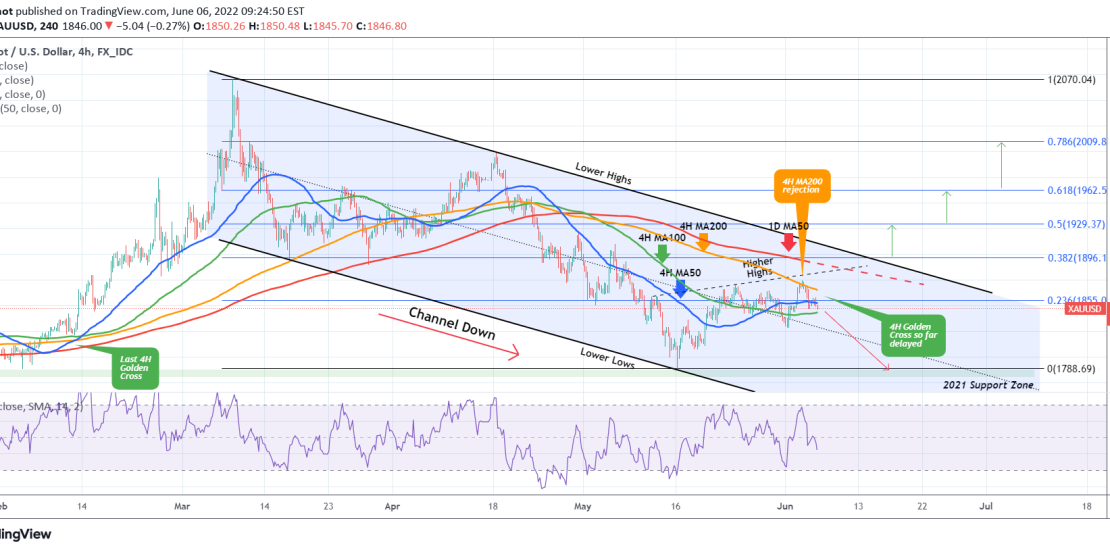
Gold (XAUUSD) has established a Channel Down pattern since its March 08 peak during the Ukraine – Russia war. Since May 16 it has been forming its new leg to a Lower High but three sessions ago it got rejected on the 4H MA200 (orange trend-line), cutting the uptrend from a 1D MA50 test
-
EURUSD Testing the Lower Highs of the 4 month Channel Down
- June 6, 2022
- Posted by: Tradingshot Articles
- Category: Forex
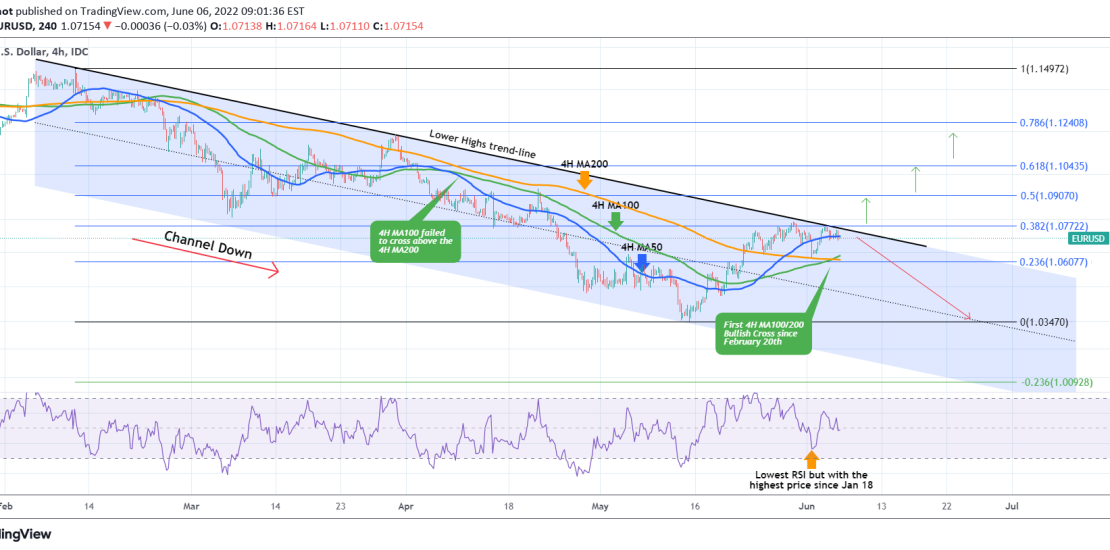
The EURUSD pair has been trading near the Lower Highs (top) trend-line of the 4 month Channel Down for the past 5 days. During this time the price tested the 4H MA200 (orange trend-line) as a Support and held. The longer it does, the stronger the buyer accumulation for breaking above the Lower Highs
-
MANAUSDT Bearish unless this level breaks
- June 3, 2022
- Posted by: Tradingshot Articles
- Category: Cryptocurrency
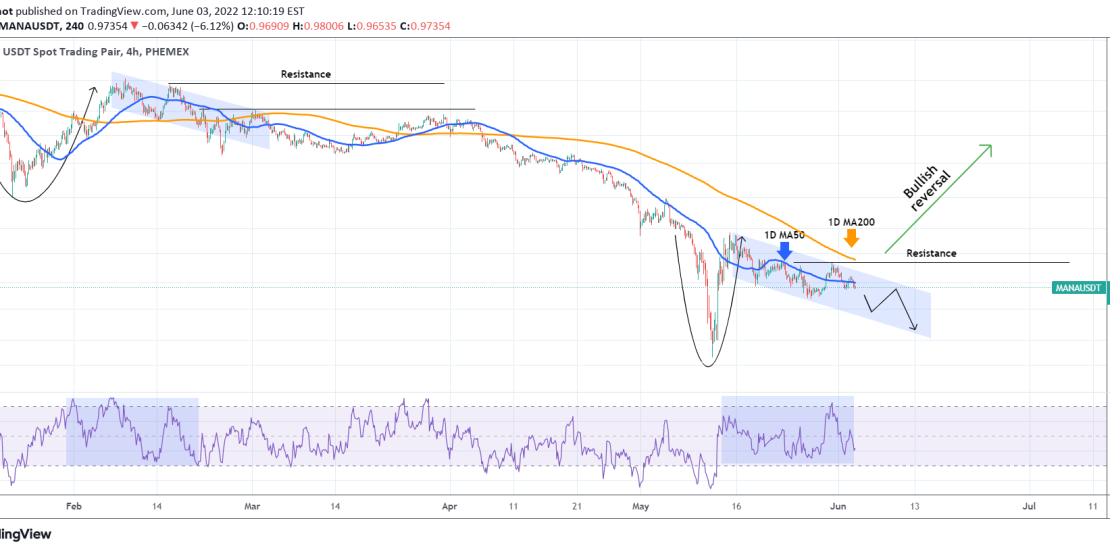
*** *** For this particular analysis on DECENTRALAND we are using the MANAUSDT symbol on the Phemex exchange. *** *** The idea is on the 4H time-frame where Mana has been trading within a Channel Down since the May 14 High. That is still a Lower High within the general bearish trend and the
-
BNBUSD Long-term action plan
- June 2, 2022
- Posted by: Tradingshot Articles
- Category: Cryptocurrency

The Binance Coin (BNBUSD) has been consolidating with the 1W MA100 (yellow trend-line) as its Support ever since the May 12 bottom and subsequent rebound. On a 1 year basis this is the ultimate range with the 705.00 Resistance and the 209.00 Support each being tested twice. There is a strong similarity between this