

2021
-
NASDAQ initiating a strong correction?
- September 8, 2021
- Posted by: Tradingshot Articles
- Category: Stock Indices
No Comments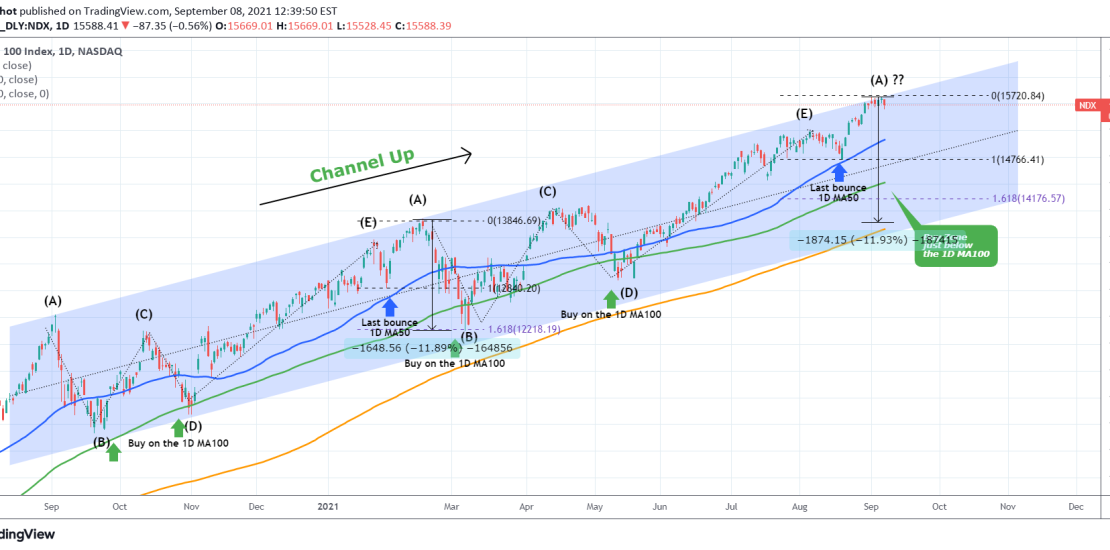
This idea is a continuation to my analysis posted on August 26: It appears that the leg count and the similarities (so far) of the current price action with the January-February sequence was correct. If the pattern continues to replicate in the same way, then Nasdaq is ahead of a strong correction as this
-
BITCOIN -20% correction in a day! Is the bleeding over?
- September 7, 2021
- Posted by: Tradingshot Articles
- Category: Cryptocurrency
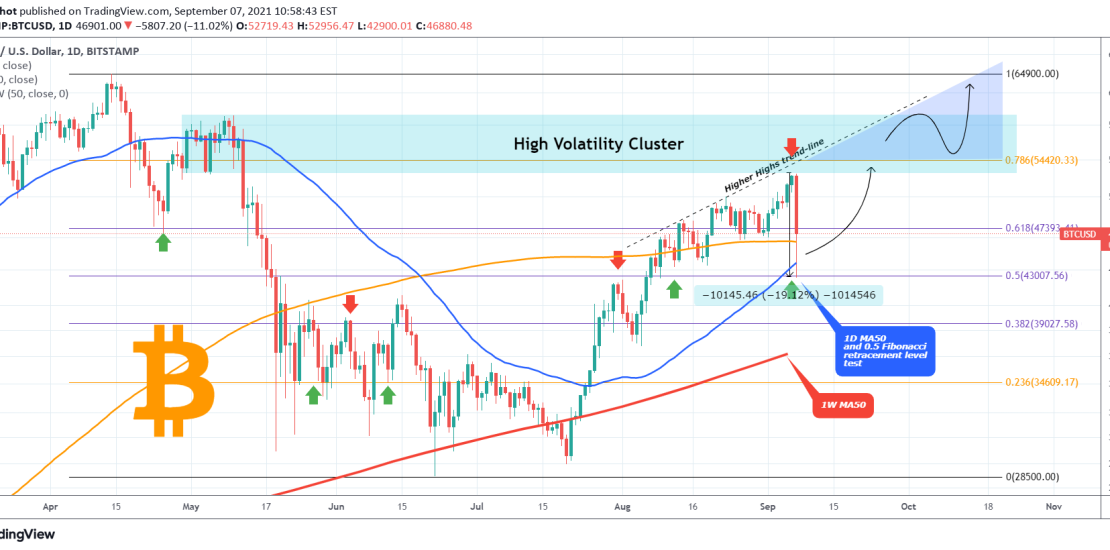
On my last Bitcoin analysis I underlined the importance that Fibonacci retracement levels along with the 1D MA50 (blue trend-line) will play on this recovery attempt. Today is a correction day for BTC with the price losing almost -20% intra day so far. The drop has been contained exactly on the 0.5 Fibonacci retracement
-
WTI OIL analysis on the 1D and 4H time-frames
- September 7, 2021
- Posted by: Tradingshot Articles
- Category: Commodities
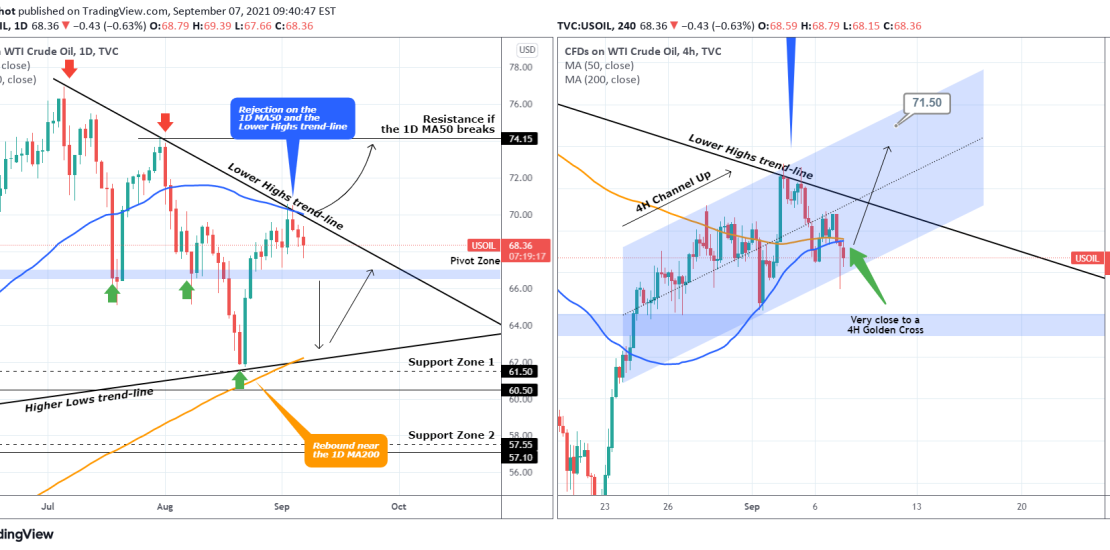
Last time I analyzed WTI Oil on August 24, I made it clear that it was trading within a long-term Triangle and until it broke, its price action would be sideways: I stressed out the importance of the 1D MA50 (blue trend-line) and the Lower Highs trend-line of that Triangle. Well as you see
-
S&P broke the 4H MA50. Starting the correction.
- September 7, 2021
- Posted by: Tradingshot Articles
- Category: Uncategorized
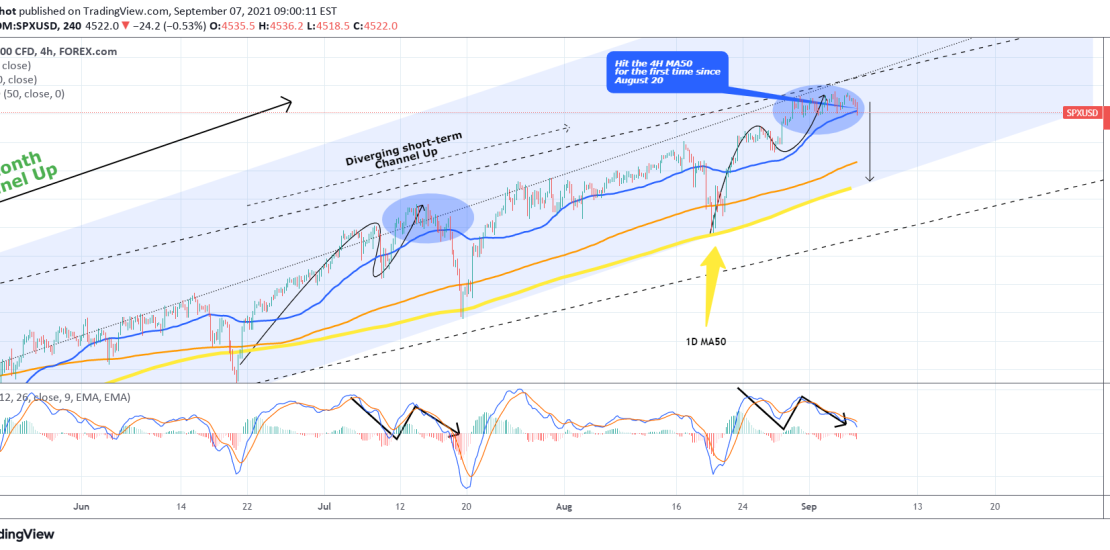
Pattern: Channel Up on 4H. Signal: Sell as the price broke below the 4H MA50 (blue trend-line) for the first time since August 20. Also the price action and the MACD is similar to the July 15 consolidation which also led to a pull-back below the 4H MA50. Target: The 1D MA50 (yellow trend-line),
-
XAUUSD broke above the 1W MA50 for the 1st time since June!
- September 3, 2021
- Posted by: Tradingshot Articles
- Category: Commodities
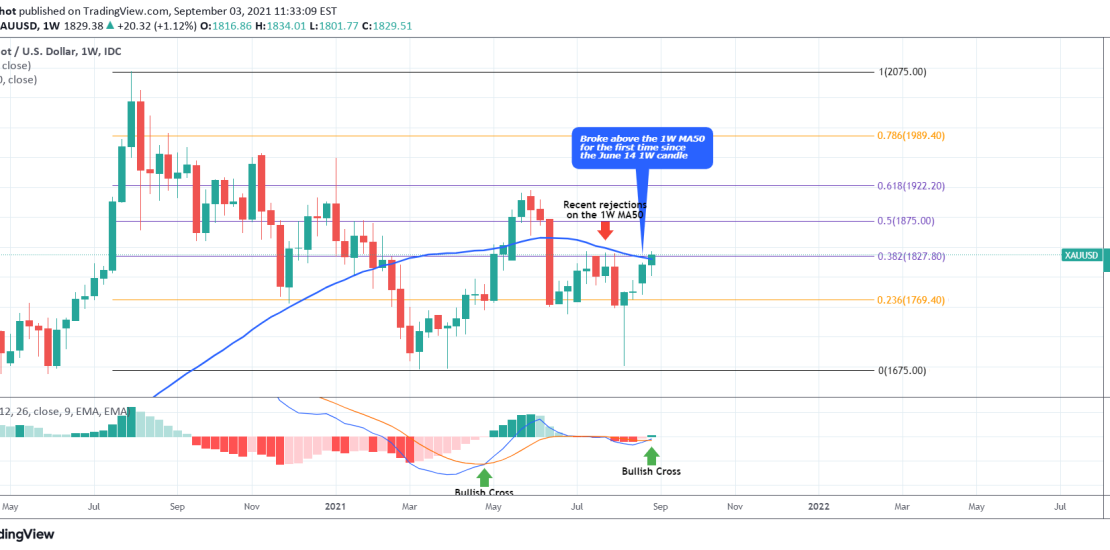
My most recent Gold signal was on the short-term time-frame of 4H: This time we have a significant technical development on long-term and I’ve moved us to the 1W time-frame where XAUUSD just broke above the 1W MA50 (blue trend-line) for the first time since the June 14 weekly candle. Closing the week above
-
XAUUSD Golden Cross formed on 4H
- August 31, 2021
- Posted by: Tradingshot Articles
- Category: Commodities
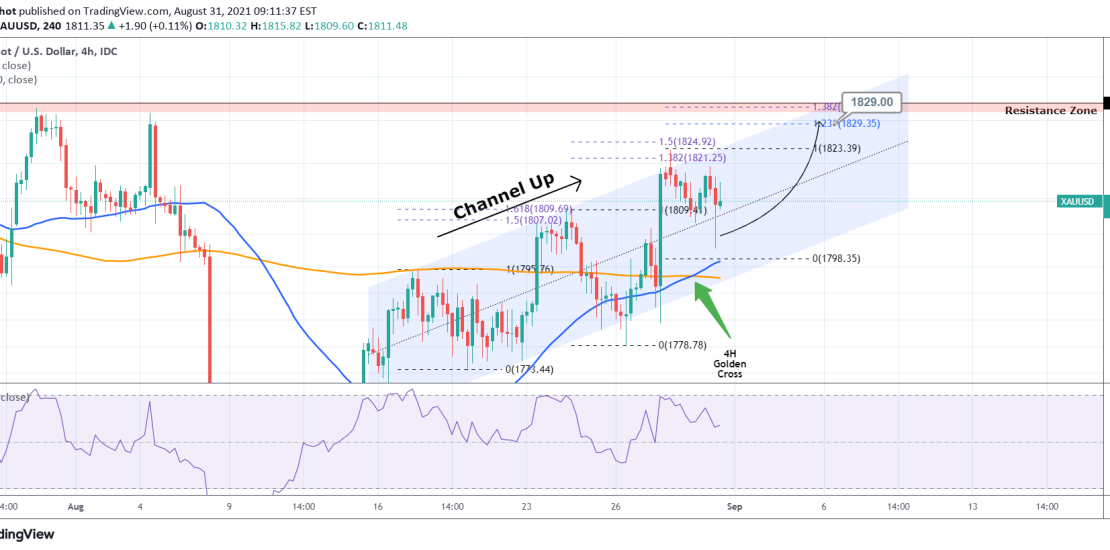
Pattern: Channel Up on 4H. Signal: Buy as the price rebounded near the 4H MA50 (blue trend-line) and even though there is still room within the Channel for one last low, the 4H Golden Cross that was formed may bring higher prices without it. Target: 1829 (just below the 1.236 Fibonacci retracement level and
-
WTI OIL had the biggest weekly rise since May 31 2020!
- August 31, 2021
- Posted by: Tradingshot Articles
- Category: Commodities
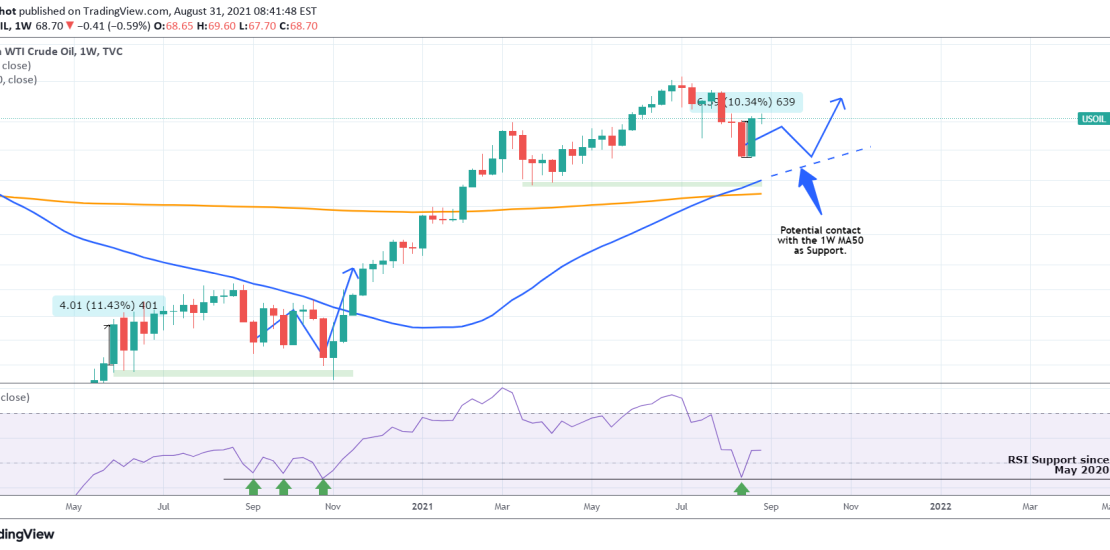
WTI Crude Oil posted last week the strongest 1W candle (+10.30%) since May 31 2020 (+11.44%). What can this possibly mean for future prices? Alone nothing. But as you see, last week’s bounce came after a 1W RSI touch on the 43.50 Support which has been holding since May 2020 as well. That makes
-
BITCOIN fun fractal.. or something more?
- August 28, 2021
- Posted by: Tradingshot Articles
- Category: Cryptocurrency
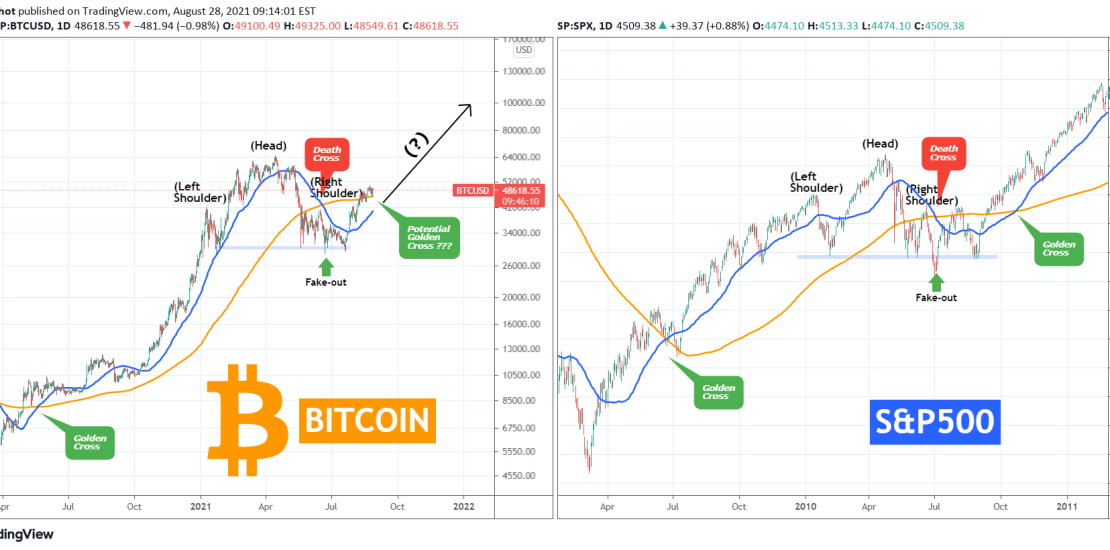
Those who follow me since my start here on TradingView or even way back on Reddit know that I am a big fun fractal comparison. I have been using this approach extensively especially on long-term technical analysis and more often than not, proves to be quite efficient. The fractal comparison I am bringing to you
-
WTI OIL aiming at the 1D MA50
- August 24, 2021
- Posted by: Tradingshot Articles
- Category: Commodities

Pattern: Triangle on 1D. Signal: Buy as the price (a) made a strong rebound on the Higher Lows trend-line, (b) near the 1D MA200 (orange trend-line) and (c) broke above the Pivot Zone. Target: The 1D MA50 (blue trend-line). Tradingview link: https://www.tradingview.com/chart/USOIL/X7DQLRmq-WTI-OIL-aiming-at-the-1D-MA50
-
XAUUSD They symmetrical harmony of Fibonacci levels
- August 24, 2021
- Posted by: Tradingshot Articles
- Category: Commodities
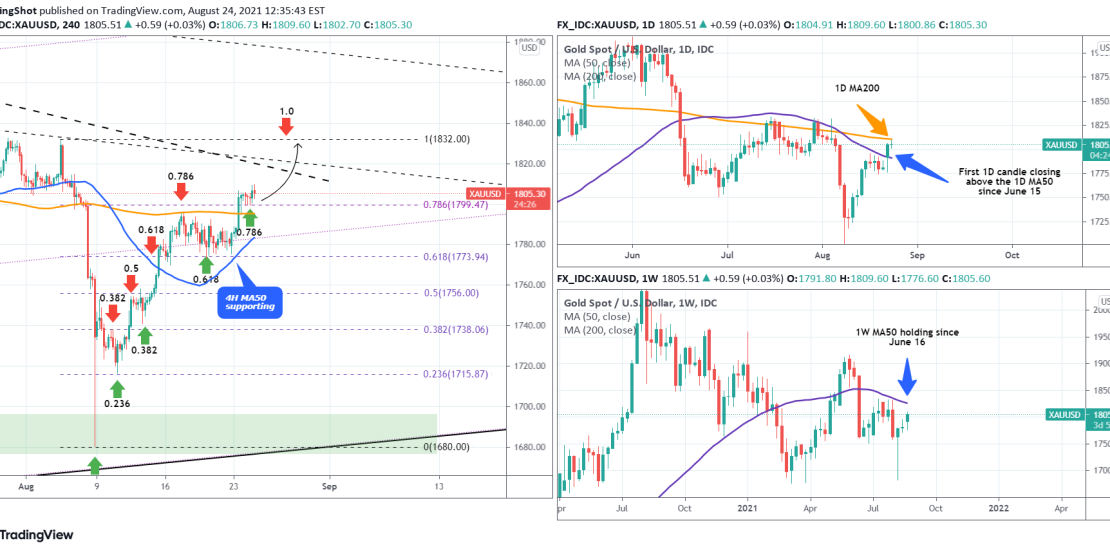
In my most recent Gold idea I introduced the importance of the Fibonacci retracement levels as targets following the August 08 flash crash of the Nonfarm Payrolls: As you see since then, the Fibs have acted very well as Resistance levels which on the following pull-backs acted as Supports. As the 0.786 Fib is