

- September 7, 2021
- Posted by: Tradingshot Articles
- Category: Cryptocurrency
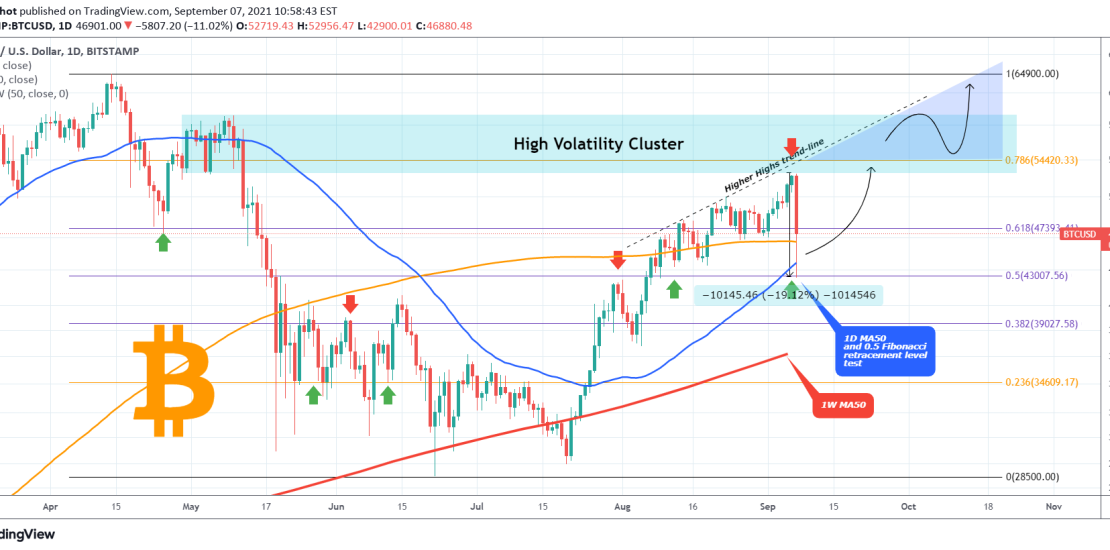
On my last Bitcoin analysis I underlined the importance that Fibonacci retracement levels along with the 1D MA50 (blue trend-line) will play on this recovery attempt. Today is a correction day for BTC with the price losing almost -20% intra day so far.
The drop has been contained exactly on the 0.5 Fibonacci retracement level, just below the 1D MA50, confirming its importance bias (so far). If BTC manages to close the session above it, then this pull-back, even though substantial, it will be nothing but a buy opportunity similar that the 1D MA50 gave from October 2020 until the April 14 2021 All Time High (ATH). If not, then the 1W MA50 (bold red trend-line) is the next line of Support.
So naturally the next question is, if the current Support levels hold, what would be the next target? Naturally as the Fibs retracement levels suggest, the next Fib to fill is the 0.786 at roughly 54400. A break above that level, brings BTC to the final barrier before the ATH, the High Volatility Cluster of 53 – 59.7k consisting of the Volatility Zone that Bitcoin traded in before the May 12 collapse started. That Cluster along with the Higher Highs trend-line, may push the price sideways for some time, even lead to the next 1D MA50 correction.
But what is your take on today’s -20% drop? Is the bleeding over and we’ll start recovering or can we see further correction towards the 1W MA50? Feel free to share your work and let me know in the comments section!
Tradingview link: