
-
NASDAQ going according to last week’s plan. Eyes on 1D MA50/100.
- April 7, 2022
- Posted by: Tradingshot Articles
- Category: Stock Indices
No Comments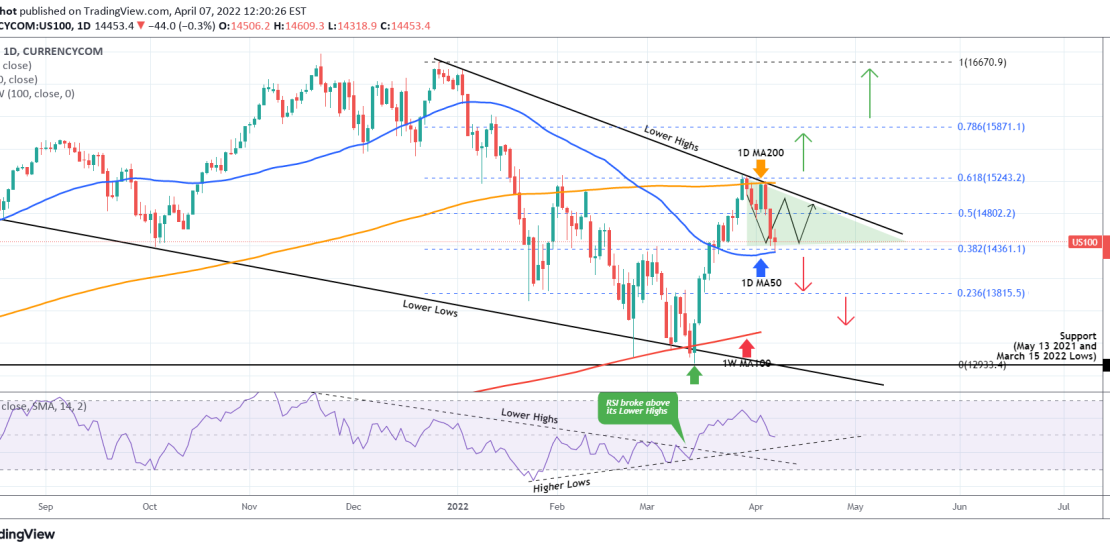
Nasdaq (NDX)has is following exactly last week’s suggested trading plan so far, as it pulled-back from the 1D MA200 (orange trend-line) and today reached the 1D MA50 (blue trend-line): This pull-back took place primarily because the index failed to break above the Lower Highs trend-line of the December 28 High and got rejected two
-
S&P500 can rise temporarily but 4400 likely mid-term.
- April 4, 2022
- Posted by: Tradingshot Articles
- Category: Stock Indices
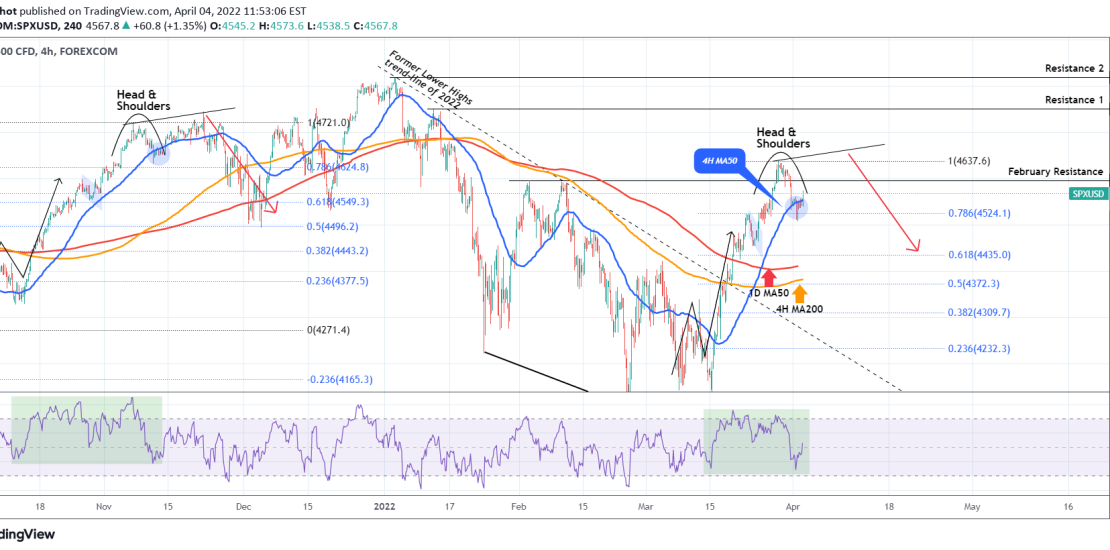
S&P500 print a Head & Shoulders pattern last week and naturally dropped below the 4H MA50 (blue trend-line) for the first time in two weeks (since March 15). The pull-back is now neutralized and we see today a bullish reaction. This rise can be temporary and even though a test of the recent High
-
NASDAQ Channel Down emerged. Trade the rejection or break-out.
- January 31, 2022
- Posted by: Tradingshot Articles
- Category: Stock Indices
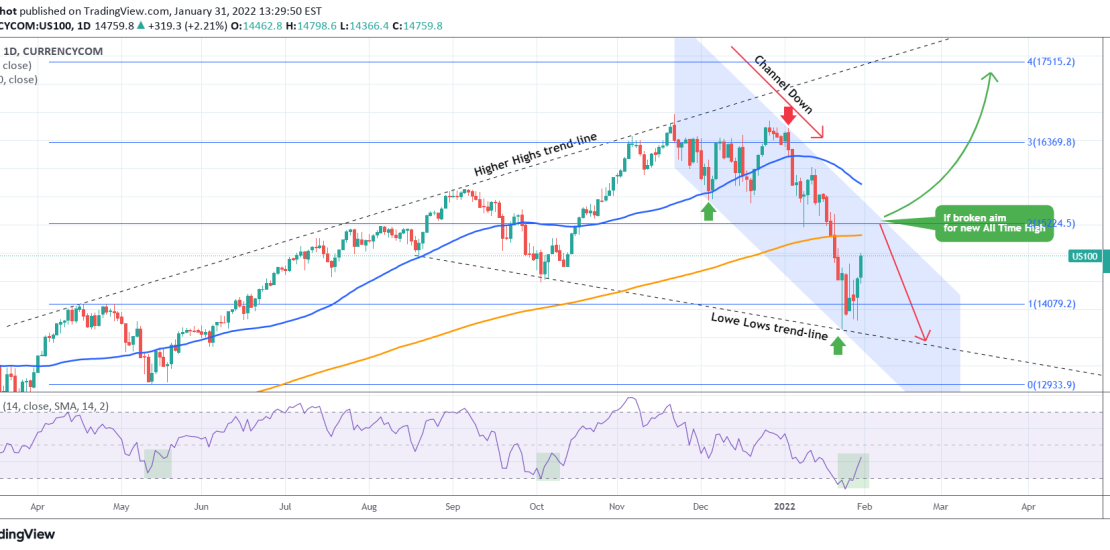
Nasdaq has suffered the most during January’s correction. The Lower Lows created a new Channel Down which we have to consider, despite having the 1D RSI make a rebound from oversold levels and a bottom formation similar to early October, mid-May and early March 2021. The 1D MA200 (orange trend-line) is the first natural
-
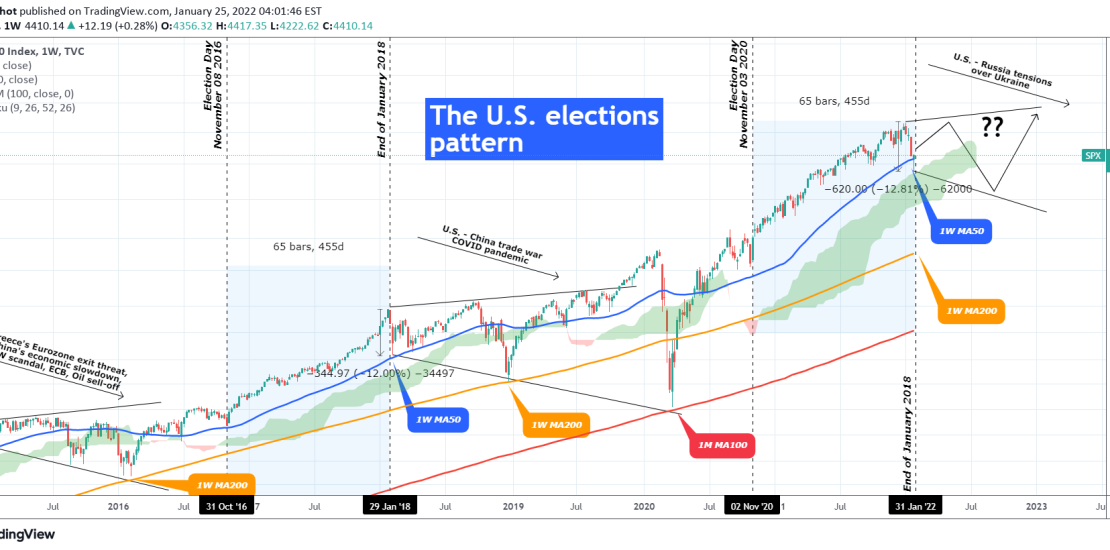
S&P500 ended the U.S elections rally. Years of volatility ahead?
- January 25, 2022
- Posted by: Tradingshot Articles
- Category: Stock Indices

This is the S&P500 index on the 1W time-frame (on the log scale). The recent sell-off (-12% so far) is leaving many wondering what is happening and rightly so as it broke below the very strong bullish pattern (Higher Highs/ Higher Lows) since the November 2020 U.S. elections. As I looked more closely into it
-
S&P500 ended the U.S elections rally. Years of volatility ahead?
- January 25, 2022
- Posted by: Tradingshot Articles
- Category: Stock Indices
This is the S&P500 index on the 1W time-frame (on the log scale). The recent sell-off (-12% so far) is leaving many wondering what is happening and rightly so as it broke below the very strong bullish pattern (Higher Highs/ Higher Lows) since the November 2020 U.S. elections. As I looked more closely into
-
U.S. stocks crashing? If so which currencies to trade?
- January 24, 2022
- Posted by: Tradingshot Articles
- Category: Other, Stock Indices
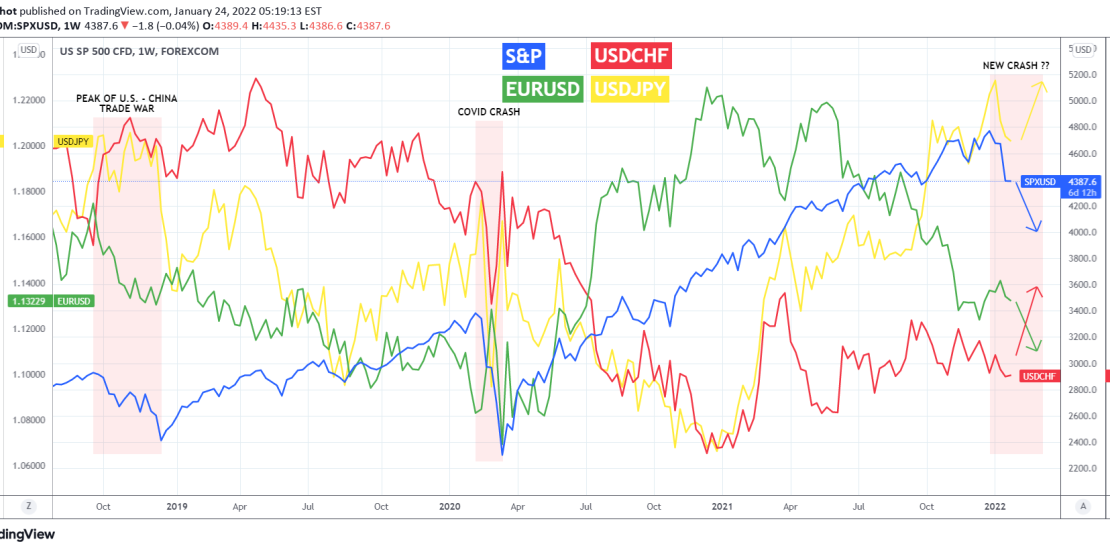
Last week was a very painful one for the U.S. (as well as global) stock markets, seeing the biggest sell-off since the March 2020 crash that was caused by the COVID outbreak panic. So if we are at the start or halfway of a typical correction on the stock markets, which currencies should we
-
DAX waves signs of exhaustion. Top might be near.
- January 5, 2022
- Posted by: Tradingshot Articles
- Category: Stock Indices
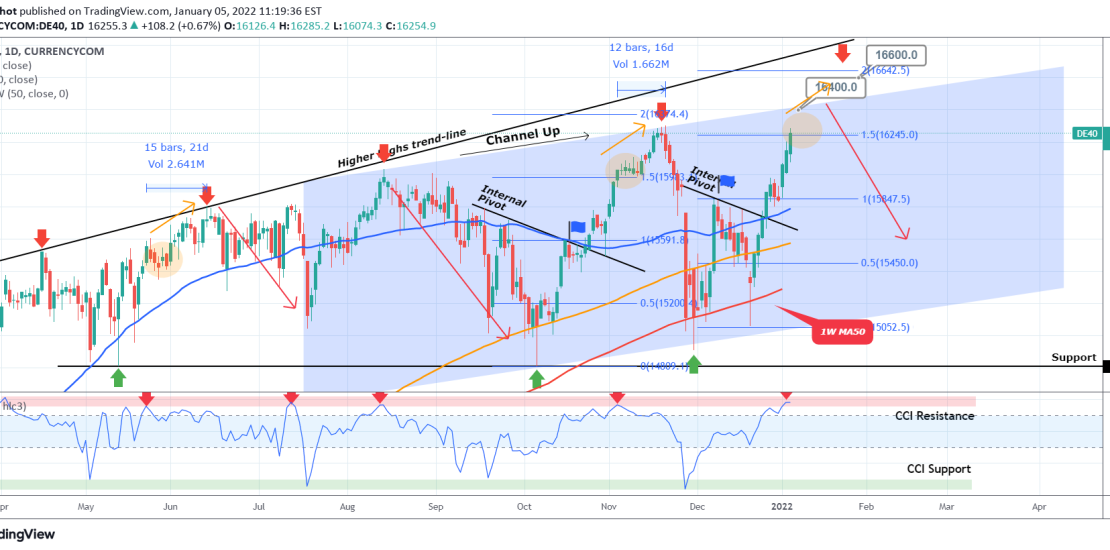
I’ve been bullish on DAX for a very long time as the Rising Wedge and Channel Up patterns prompted to Higher Highs ever since April 2021: However, the German index seems to be forming a pattern that based also on the 1D CCI, was previously seen just before market tops (i.e. Higher Highs on
-
DOW JONES hit the 1D MA200. Buy fractal spotted.
- December 20, 2021
- Posted by: Tradingshot Articles
- Category: Stock Indices
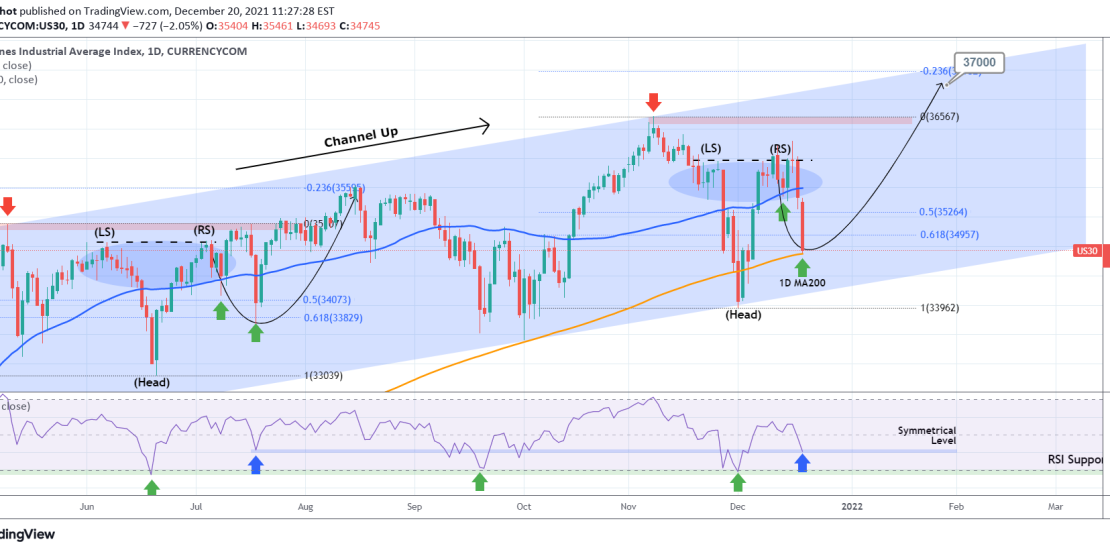
Dow Jones has had a very sharp two-day pull-back, which hit today the 1D MA200 (orange-trend-line). That came off an Inverse Head and Shoulders pattern (IH&S) that continues to resemble that of June – July. With the 1D RSI hitting the Symmetrical Support level of the July 19 low which initiated the strong rebound
-
DOW JONES and the fractal of DOOM it should avoid
- December 15, 2021
- Posted by: Tradingshot Articles
- Category: Stock Indices
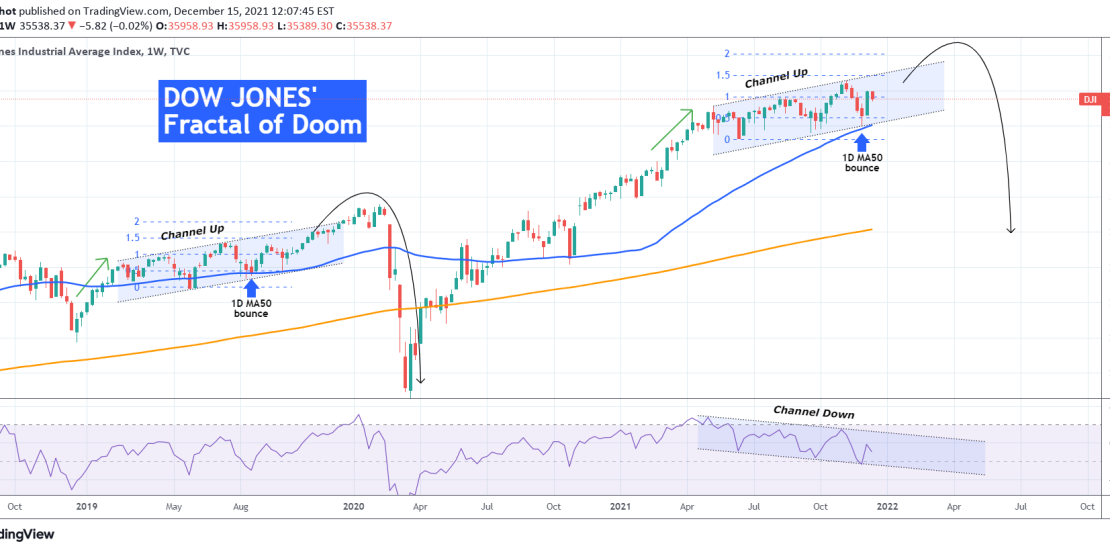
Dow Jones has been trading inside a Channel Up since the Q2 of 2021 a time during which I have been bullish buying every Higher Low within the pattern. This hasn’t changed, especially after it recently made a strong rebound exactly on the 1W MA50 (blue trend-line), which during long-term uptrends is typically the major
-
DOW JONES Buy opportunity on the 1D MA200 and 0.618 Fib
- December 1, 2021
- Posted by: Tradingshot Articles
- Category: Stock Indices
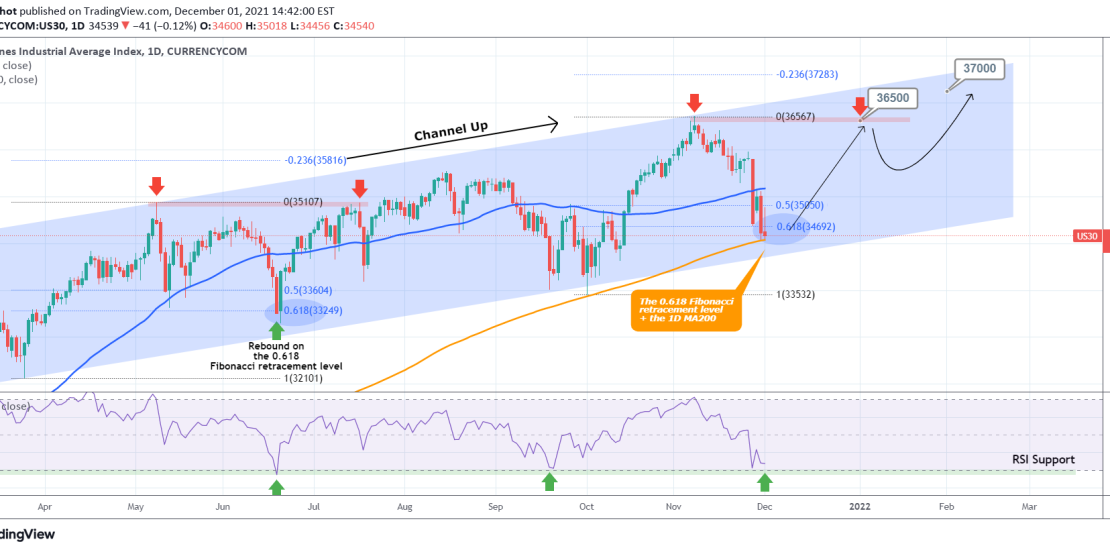
Pattern: Channel Up on 1D. Signal: Buy as the price reached both the 0.618 Fibonacci retracement level as well as the 1D MA200 (orange trend-line). The last parameter to fulfil is the RSI Support, so allow margin for one last low at the bottom of the Channel Up. Target: 36500 (Resistance and All Time
