

- January 31, 2022
- Posted by: Tradingshot Articles
- Category: Stock Indices
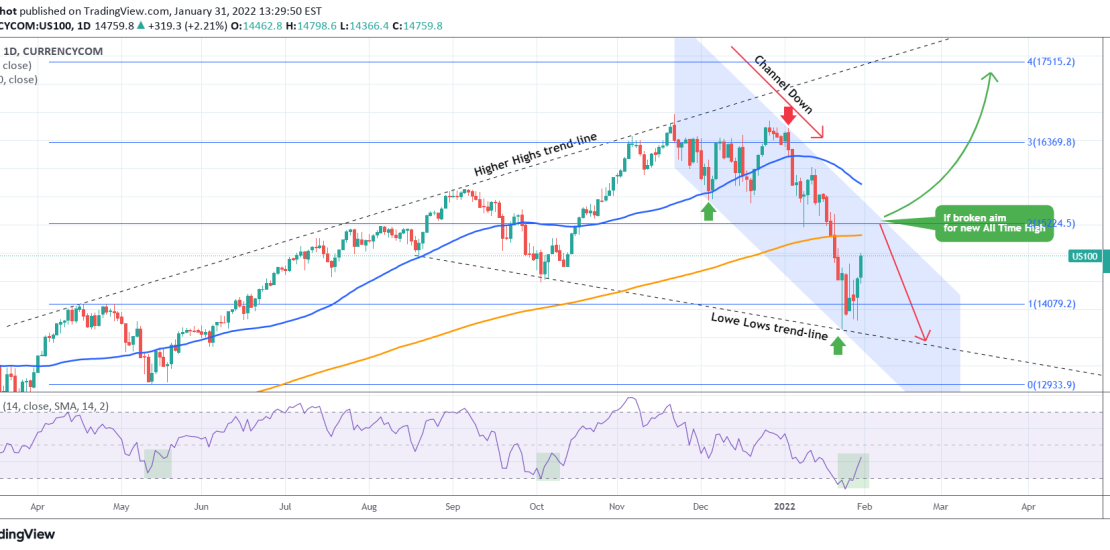
Nasdaq has suffered the most during January’s correction. The Lower Lows created a new Channel Down which we have to consider, despite having the 1D RSI make a rebound from oversold levels and a bottom formation similar to early October, mid-May and early March 2021.
The 1D MA200 (orange trend-line) is the first natural Resistance. If the price gets rejected at the top of the Channel Down (Lower Highs trend-line), we’ll have a sell signal targeting the Lower Lows trend-line.
On the other hand, a break above the Channel Down along with closing above the 1D MA50 (blue trend-line), will be a confirmation that the index has recovered the long-term bullish trend and will be a buy signal towards the Higher Highs trend-line with a rough technical target the 4.0 Fibonacci extension at 17515.
Tradingview link: