

- January 5, 2022
- Posted by: Tradingshot Articles
- Category: Stock Indices
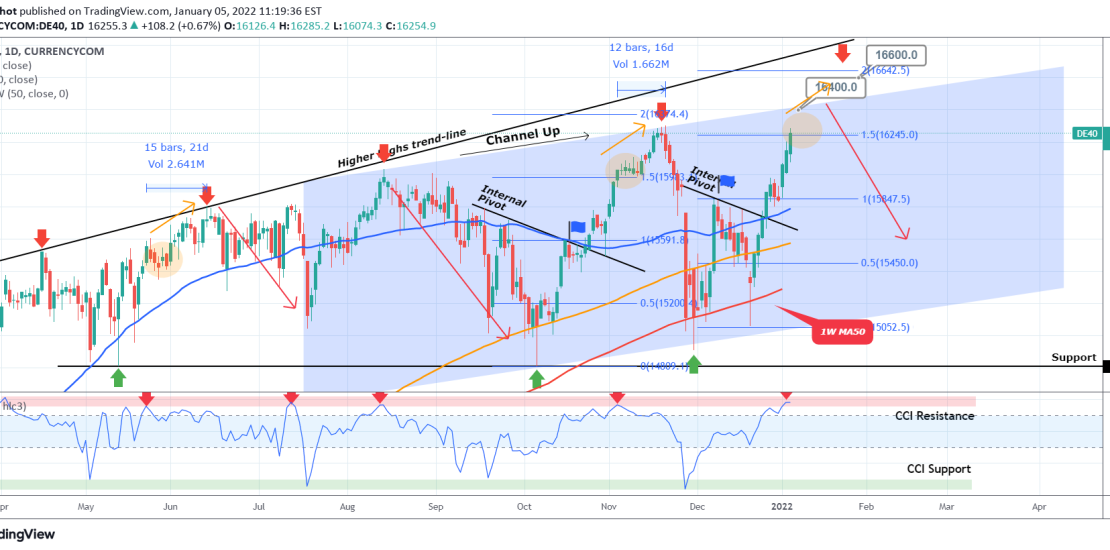
I’ve been bullish on DAX for a very long time as the Rising Wedge and Channel Up patterns prompted to Higher Highs ever since April 2021:

However, the German index seems to be forming a pattern that based also on the 1D CCI, was previously seen just before market tops (i.e. Higher Highs on the pattern). As this 1D chart shows, the price just entered the CCI Resistance Zone that has been holding throughout the whole of last year. On two occasions (July 13 2021, August 12 2021) the CCI top matched with direct market tops. On the other two occasions (May 24 2021, November 03 2021), it made the price consolidate (orange circles) and made one last (blow-off) top 15 and 12 sessions later respectively.
The above means that we’ve either topped or will top within the next two weeks. Potential peak points include 16400 (top/ Higher High of the Channel Up) and 16600 (just below the 2.0 Fibonacci extension level as it happened with the November 19 Top). In either case, a strong pull-back towards the 1W MA50 (red trend-line) should be expected.
Tradingview link:
https://www.tradingview.com/chart/DE40/C2aSUtlh-DAX-waves-signs-of-exhaustion-Top-might-be-near