- April 4, 2022
- Posted by: Tradingshot Articles
- Category: Stock Indices

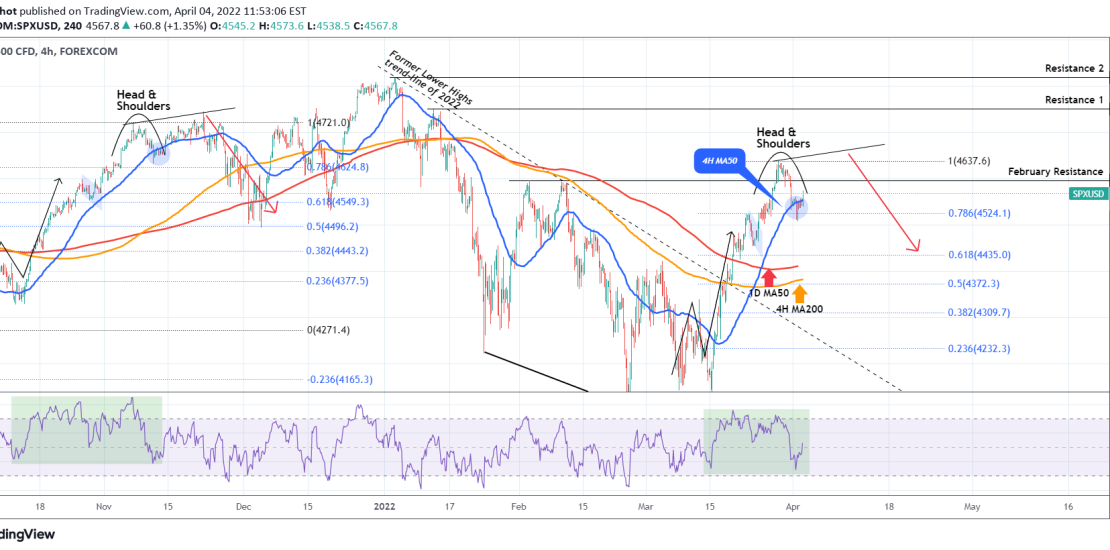
S&P500 print a Head & Shoulders pattern last week and naturally dropped below the 4H MA50 (blue trend-line) for the first time in two weeks (since March 15). The pull-back is now neutralized and we see today a bullish reaction. This rise can be temporary and even though a test of the recent High is possible, it is more likely to see in the medium-term a test of the 4H MA200 (orange trend-line) and even lower.
The guide for this is the fact that both price wise and based on the RSI on the 4H time-frame, the rise since the March 15 low is quite similar to that of October 01 – November 10 2021. As you see on the chart, the index formed a similar Head and Shoulders pattern that initially dropped below the 4H MA50 and even though it made one last mini-rally to the Head of the formation, it eventually pulled much lower, below the 4H MA200 and 1D MA50 (red trend-line). Currently this rough pull-back projection is around 4400.
Tradingview link:

