- December 15, 2021
- Posted by: Tradingshot Articles
- Category: Stock Indices

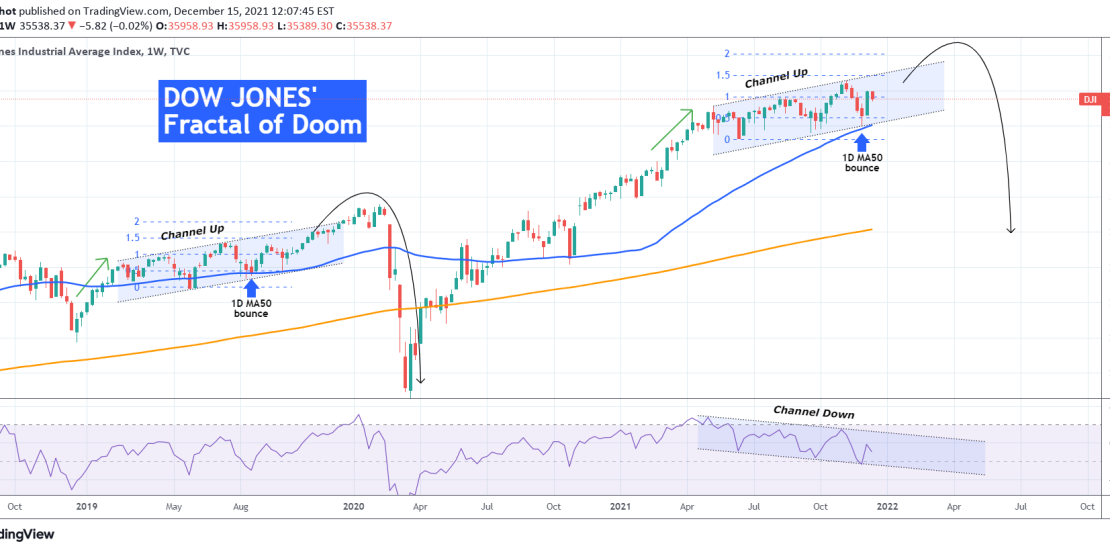
Dow Jones has been trading inside a Channel Up since the Q2 of 2021 a time during which I have been bullish buying every Higher Low within the pattern. This hasn’t changed, especially after it recently made a strong rebound exactly on the 1W MA50 (blue trend-line), which during long-term uptrends is typically the major Support.
However with this analysis I want to bring to your attention, a technical possibility based on the charts, which shows that DJI’s long-term bullish trend may not have more than another quarter left before a major correction occurs.
As you see on this chart, which is on the 1W (weekly) time-frame, while the index has been on this Channel Up (Higher Lows and Higher Highs), its very RSI indicator has been trading on a Channel Down (Lower Highs and Lower Lows) for the same time-span. This constitutes a Bearish Divergence and technically indicates that the dominant trend (i.e. the uptrend) has been losing its earlier strength.
Now we come to the major part of the analysis. On top of that Bearish Divergence, which is alarming on its own, the last time a similar Channel Up has been spotted was from February to November 2019. As you see there is almost a perfect symmetry between the two both in terms of the Fibonacci retrace and extension levels, as well as the bounce on the 1D MA50 and below the 0.5 Fib at the exact same spot on the Channel Up pattern.
This correlation suggests that, assuming the pattern replicates almost the same way, when the Channel Up breaks to the upside (i.e. above its top/ Higher Highs trend-line), a top might form soon after (a month or so), and as the index will get massively overbought, a sharp quarterly correction may follow. Now of course back in Feb-March 2020 the sole driver/ catalyst behind this massive correction was the COVID pandemic outbreak and an event like that can’t be repeated that soon, however the markets tend to find and capitalize on any fundamental catalyst they can find at a given time in order to fulfil a long-term re-occurring pattern.
What do you think? Should this ring a bell early on for the global stock markets or not?
Tradingview link:
https://www.tradingview.com/chart/DJI/FOmxLPoE-DOW-JONES-and-the-fractal-of-DOOM-it-should-avoid/

