

- April 7, 2022
- Posted by: Tradingshot Articles
- Category: Stock Indices
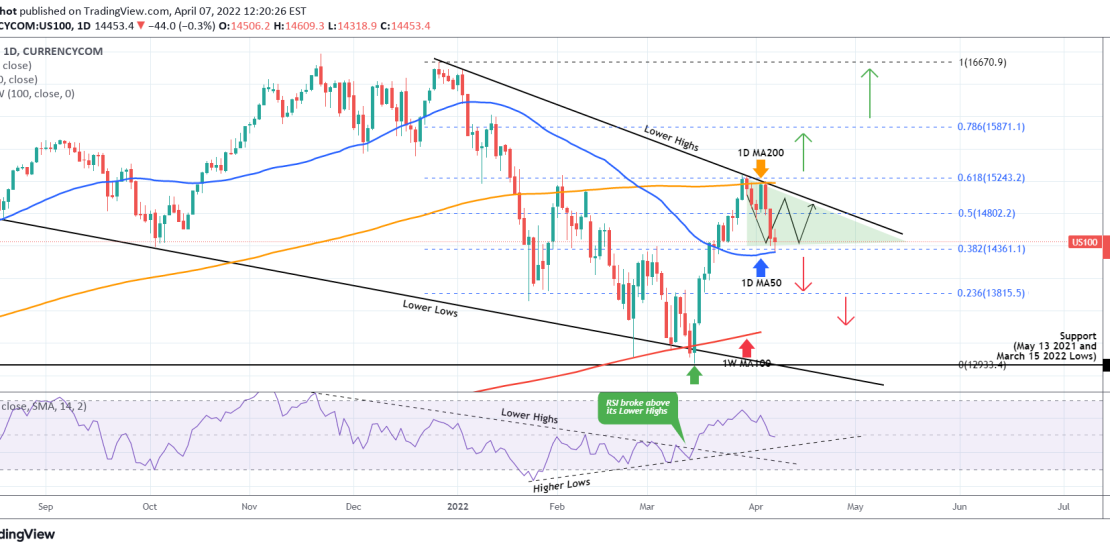
Nasdaq (NDX)has is following exactly last week’s suggested trading plan so far, as it pulled-back from the 1D MA200 (orange trend-line) and today reached the 1D MA50 (blue trend-line):

This pull-back took place primarily because the index failed to break above the Lower Highs trend-line of the December 28 High and got rejected two times. So far, as I displayed with the green Triangle, this is a neutral zone. Some scalping value can be found within. However the medium-term trend is about to be revealed:
* A break below the 1D MA50 (needs a 1D candle closing below), which is also the 0.382 Fibonacci retracement level, opens the way for more selling towards Fib 0.236 (13815) and the 1W MA100 (red trend-line), which supported twice before on February 24 and March 15.
* A break above the Lower Highs or better yet the 1D MA200, which is also the 0.618 Fibonacci retracement level, restores the bullish trend aiming at Fib 0.786 (15870) and the 16670 High. The 1D RSI so far favors the bullish scenario.
Tradingview link: