
-
DAX 1D Golden Cross is bullish but mid-term indicates volatility
- December 9, 2022
- Posted by: Tradingshot Articles
- Category: Stock Indices
No Comments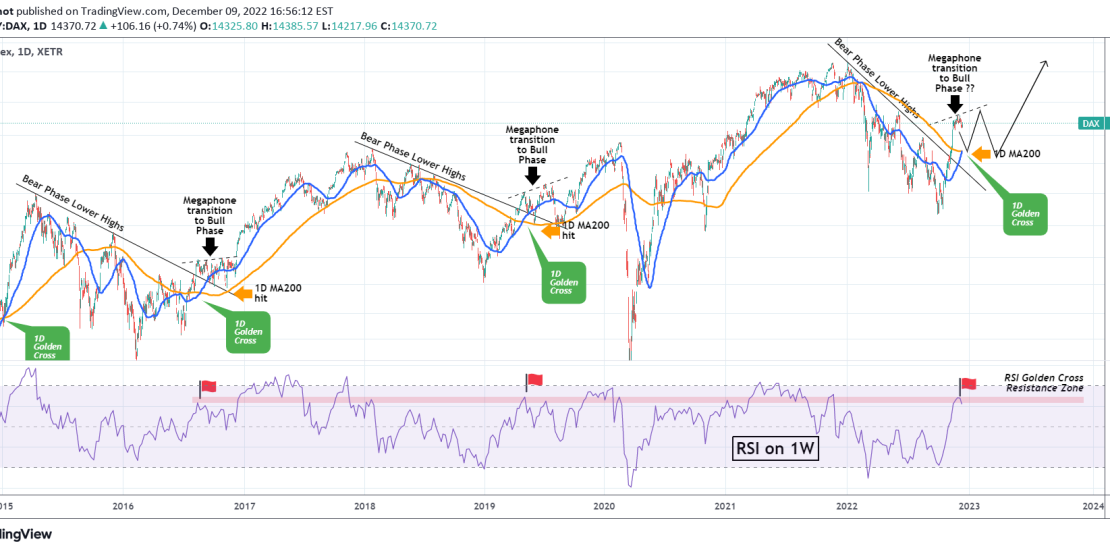
Today the German stock market (DAX) completed a Golden Cross pattern on the 1D time-frame, which is when the 1D MA50 (blue trend-line) crosses above the 1D MA200 (orange trend-line). That is technically a bullish formation and that is what we interpret it as, at least on the long-term. Historically a 1D Golden Cross
-
NASDAQ Almost 1 month trapped within the 1D MA50 – MA100
- December 8, 2022
- Posted by: Tradingshot Articles
- Category: Stock Indices
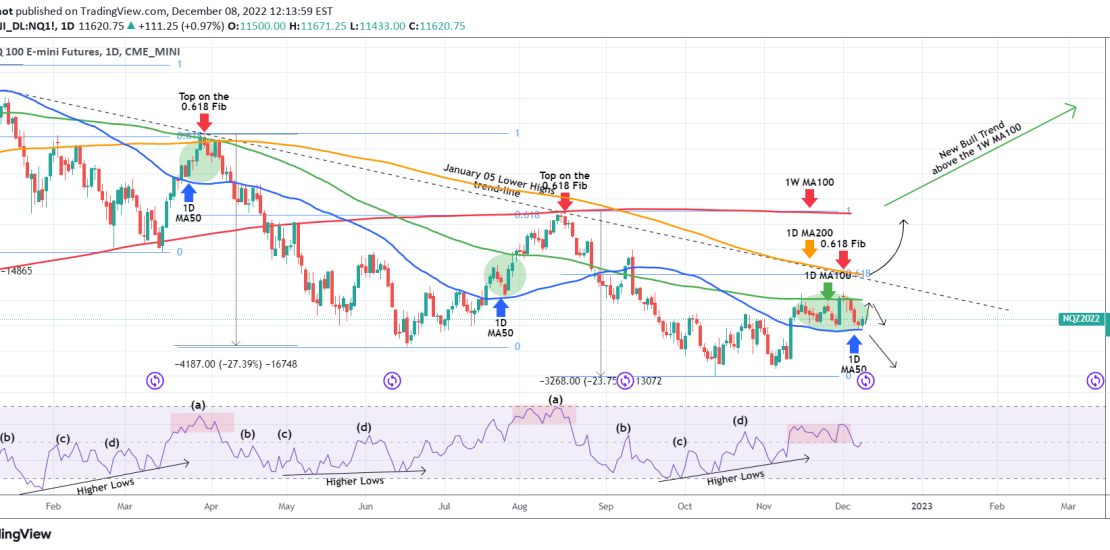
Nasdaq (NDX) has been trading sideways since November 10, with the 1D MA50 (blue trend-line) as Support and the 1D MA100 (green trend-line) as Resistance. On a wide scale, this technically looks like the previous two market tops on the January 05 Lower Highs trend-line, and the 1D RSI illustrates that clearly. However, the
-
DOW JONES ready to rally! Inflation peaked on a 100 year line!
- December 8, 2022
- Posted by: Tradingshot Articles
- Category: Stock Indices
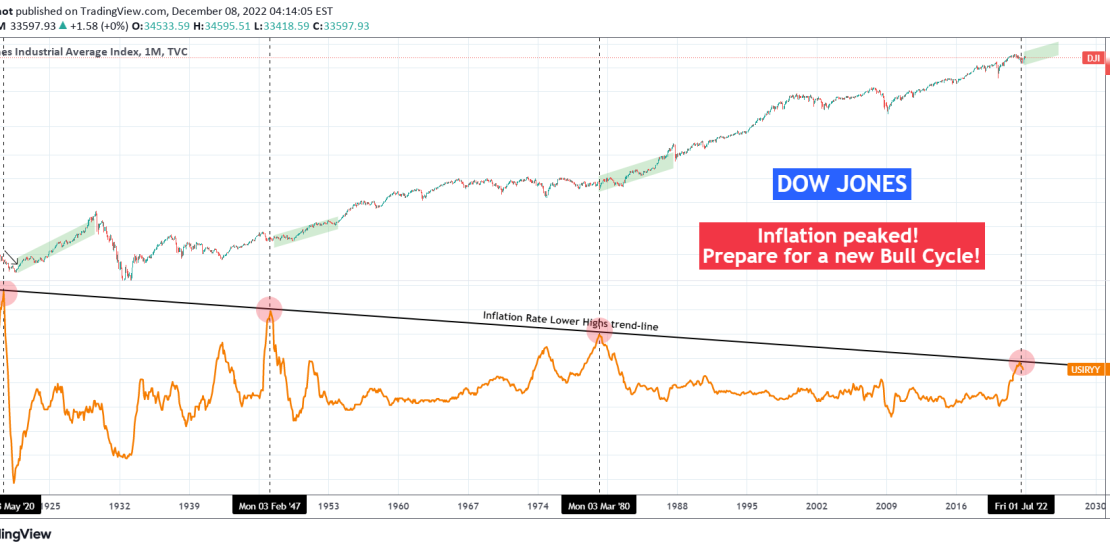
The Dow Jones index (DJI) has been on an enormous rise since late September that even made a Higher High above the 2022 descending Resistance. With inflation being the main catalyst of this 2022 correction, it should come as no surprise that when it normalizes, the index can start seeing growth again. Well on
-
S&P500 What crisis? We’re still in a cyclical Bull.
- December 1, 2022
- Posted by: Tradingshot Articles
- Category: Stock Indices
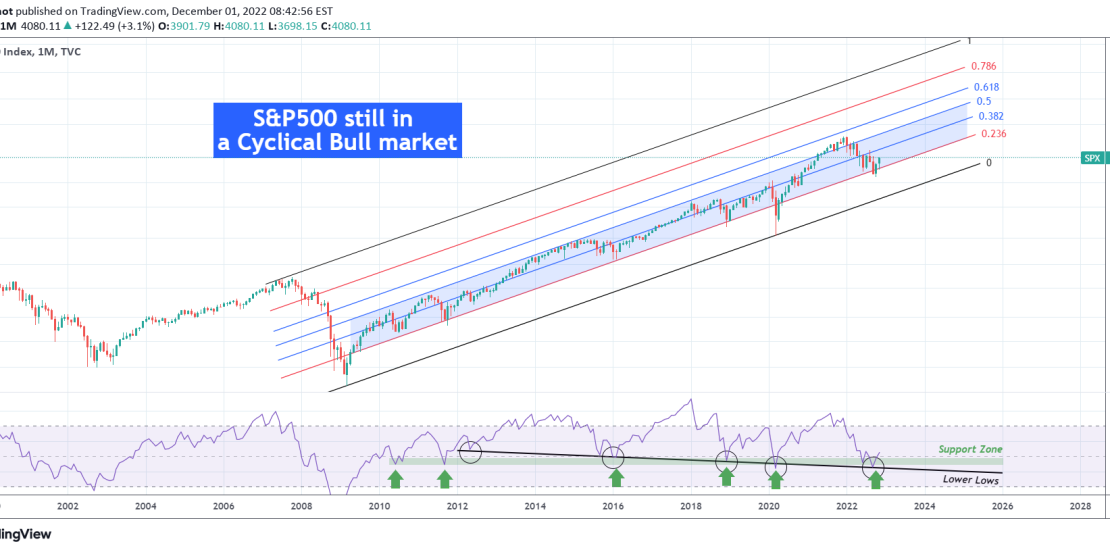
This is the S&P500 index (SPX) on the 1M (monthly) time-frame illustrating key levels and zones using the Fibonacci Channel. We focus on the price action and pattern created following the last major crisis, the 2008 housing crash. As you see, since that Bear Cycle correction, S&P500 has been trading within a steady Channel
-
DAX ‘s incredible 8 straight green week rally may come to an end
- November 29, 2022
- Posted by: Tradingshot Articles
- Category: Stock Indices
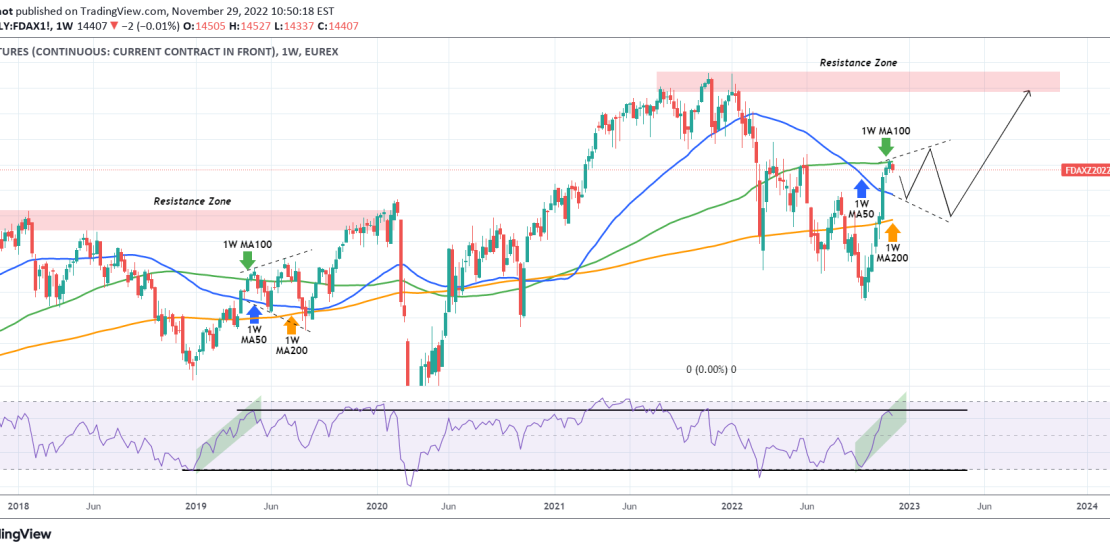
The German Index (DAX) hit last week its 1W MA100 (green trend-line) and early this week, the 1W candle is pulling-back in red. If it closes this way, it will be the first week of loss (red) since late September, running an amazing streak of 8 straight green ones. With the 1W RSI almost
-
DOW JONES doing what it has always done through history. Rising.
- November 25, 2022
- Posted by: Tradingshot Articles
- Category: Stock Indices
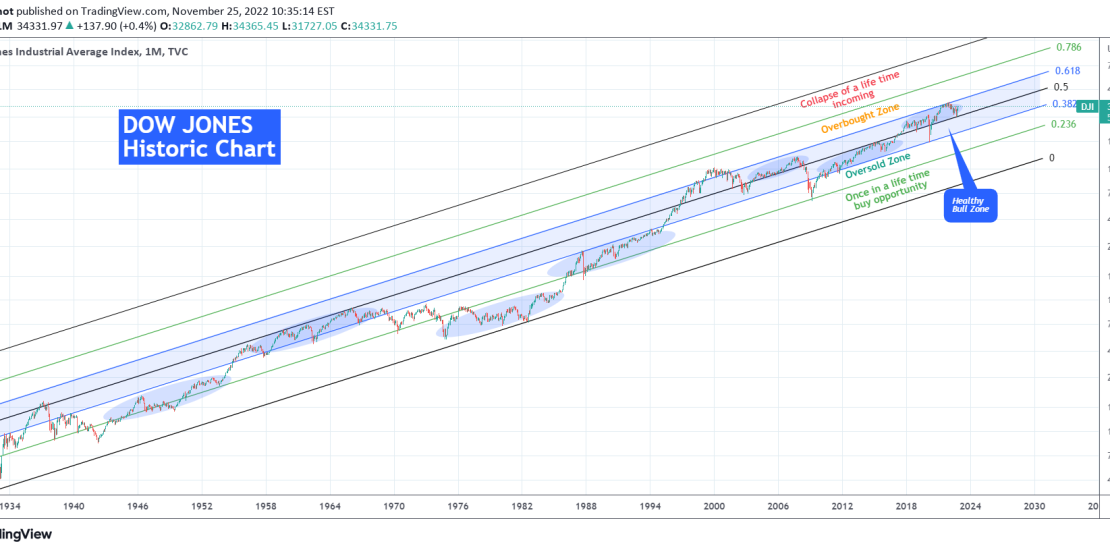
This is the Dow Jones Industrial Average Index (DJI) on the log scale since the great depression of the 1930s. A lot of talk is being done lately on whether or not this recent rally is sustainable, or if the high inflation can cause a deeper correction etc. In order to put things into
-
S&P500 The inflation crisis is just a minor cyclical event!
- November 2, 2022
- Posted by: Tradingshot Articles
- Category: Stock Indices
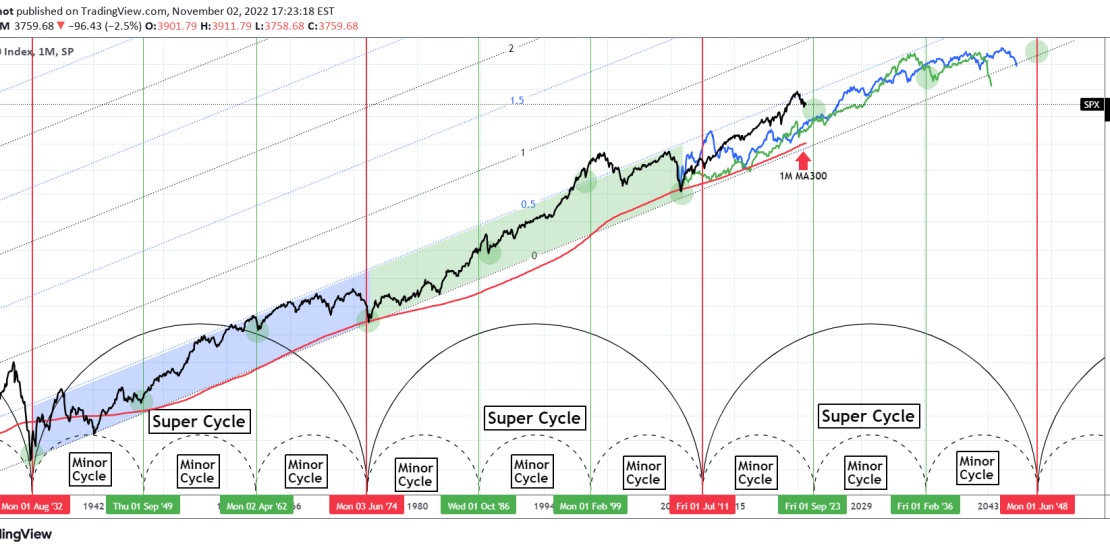
This is a complete roadmap of the S&P500 index (SPX) on the 1M time-frame, where we have taxonomized its historical trend on Super Cycles and Minor Cycles. As you see, since the Great Depression, we can categorize a whole era (approximately 42 years) as a Super Cycle. Super Cycles tend to end with a
-
S&P500 Huge confirmation of our bull pattern repeat.
- October 24, 2022
- Posted by: Tradingshot Articles
- Category: Stock Indices
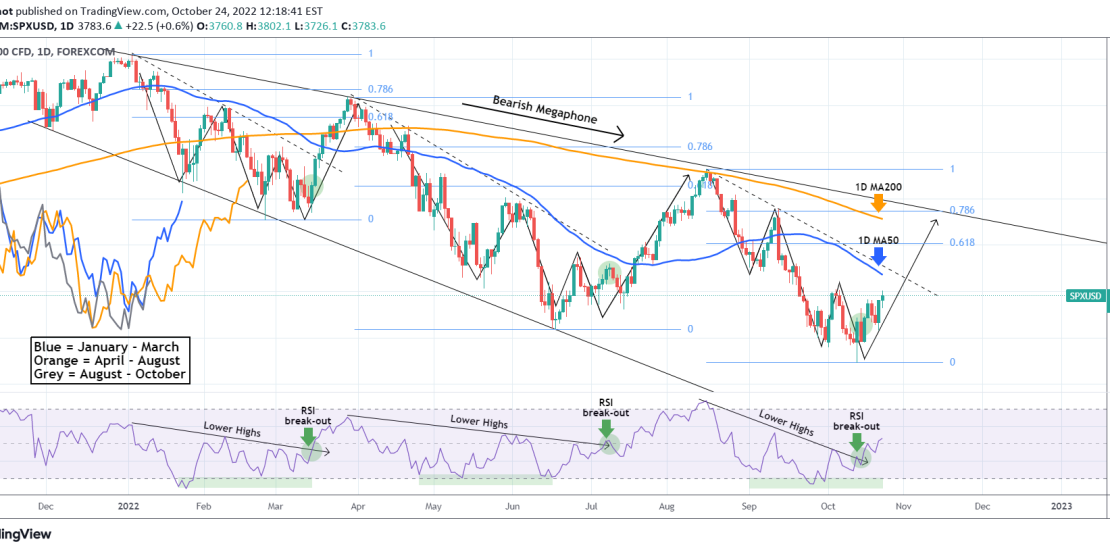
Right on the October 13 2022 low, when the CPI number came out higher than expected and the market was in extreme fear mode, we posted the following idea on the S&P500 index (SPX), explaining how fundamentally the report was still lower than the previous month and more importantly how technically the index was
-
S&P500 Bullish Divergence on RSI targets 4000 short-term
- October 18, 2022
- Posted by: Tradingshot Articles
- Category: Stock Indices
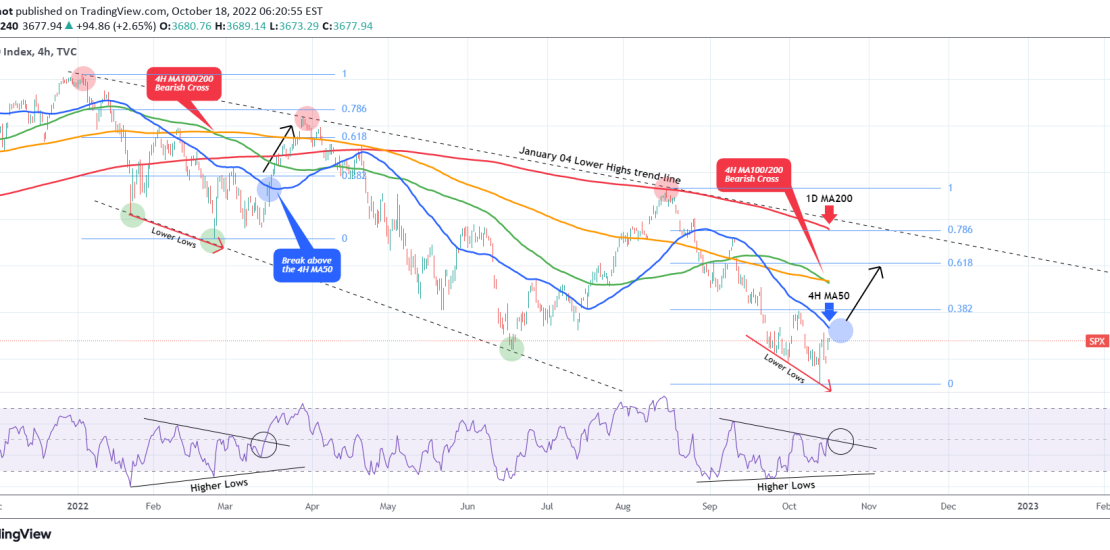
The S&P500 index (SPX) has been trading within a Bearish Megaphone pattern through this Bear Cycle of 2022. Since August 31, despite having the candle action on Lower Lows, the RSI on the 4H time-frame has been on Higher Lows, i.e. flashing a Bullish Divergence. The only other time that this took place within this
-
S&P500 CPI higher than expected. Can it repeat this bullpattern?
- October 13, 2022
- Posted by: Tradingshot Articles
- Category: Stock Indices

The U.S. CPI came in higher than expected at 8.2% against a 8.1% forecast but lower than the previous month (8.3%). It remains to be seen how the market will react to that. Technically though, the bearish leg of S&P500 (SPX) since the August 16 Lower High within this 2022 Bearish Megaphone, is close
