

- February 24, 2023
- Posted by: Tradingshot Articles
- Category: Stock Indices
In our last Nasdaq (NDX) analysis 10 days ago, we called for a short-term correction after the price already filled the Gap of Resistance 1 (12985) and started making Lower Highs:

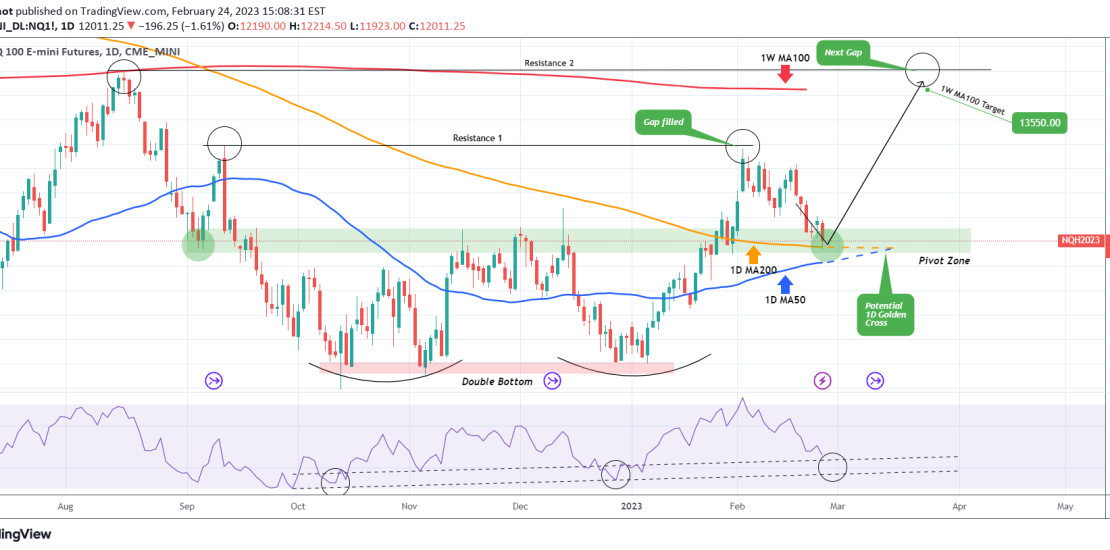
Our target was the 6-month Pivot Zone, which is a symmetrical liquidity level, Support in early September and Resistance in mid November to mid December. In our analysis that is the ultimate test to prove that the Double Bottom of late 2023 was indeed a Cycle bottom.
The index hit today its 1D MA200 (orange trend-line) and within 3 weeks the 1D MA50 (blue trend-line) can potentially break above it, forming the first 1D Golden Cross since May 21 2020. The 1D RSI has a clear Higher Lows Support Zone, which is about to enter, so many indicators point to a rebound soon.
It is worth positioning ourselves earlier for a medium-term rally that will fill the next Gap on Resistance 2 (13750), though of course the 1W MA100 (red trend-line) needs to be considered as a Target too as it rejected the index back on August 16 2022.
Tradingview link: