

- December 14, 2022
- Posted by: Tradingshot Articles
- Category: Stock Indices
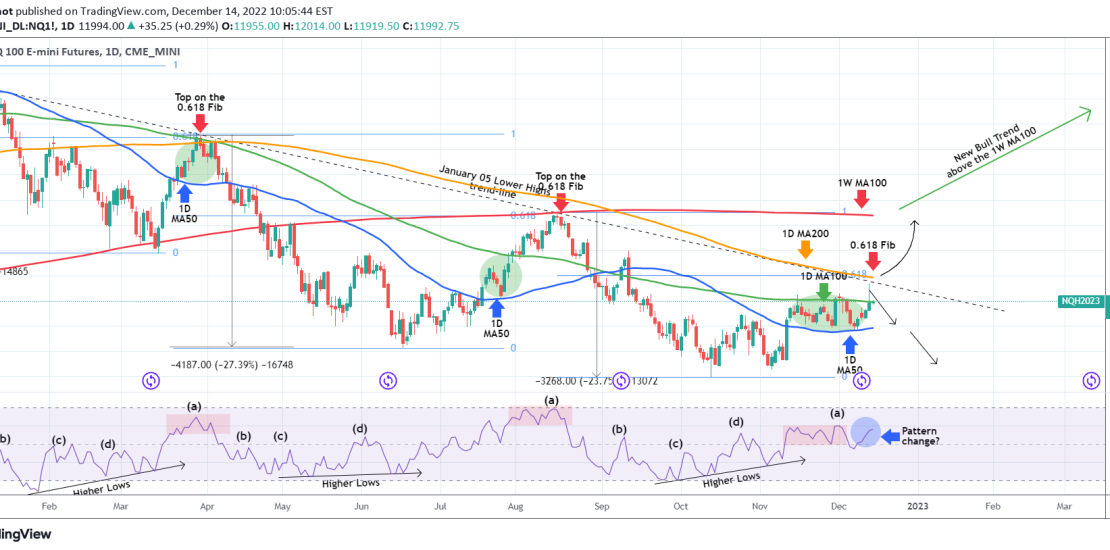
The Nasdaq index (NDX) rose yesterday aggressively after the lower than expected U.S. CPI but got rejected exactly on the 1 year Lower Highs trend-line (started on January 05), just below the 0.618 Fibonacci, as we showed on our analysis 2 weeks ago:

As you see, this is the exact cluster level (Lower Highs on 0.618 Fib) that the Highs of March 29 and August 16 were rejected. As a result, this doesn’t alter our long-term perspective which continues to be based on break-outs. The 1D MA200 (orange trend-line) has been intact since April 05 and if the price breaks above it, we will turn bullish again, targeting the 1W MA100 (red trend-line), which rejected the August 16 High.
As long as the price is below the Lower Highs trend-line, we will be targeting the 1D MA50 (blue trend-line) where a candle close below will bring more selling pressure towards the Nov – Oct Lows.
It is worth mentioning though that the 4H RSI pattern that has been consistent in the previous Lower Lows – Lower Highs sequence these past 12 months, turned upwards (blue circle) instead of downwards. This may be an early signal that there is a long-term trend shift from bearish to bullish.
Tradingview link: