

- February 14, 2023
- Posted by: Tradingshot Articles
- Category: Stock Indices
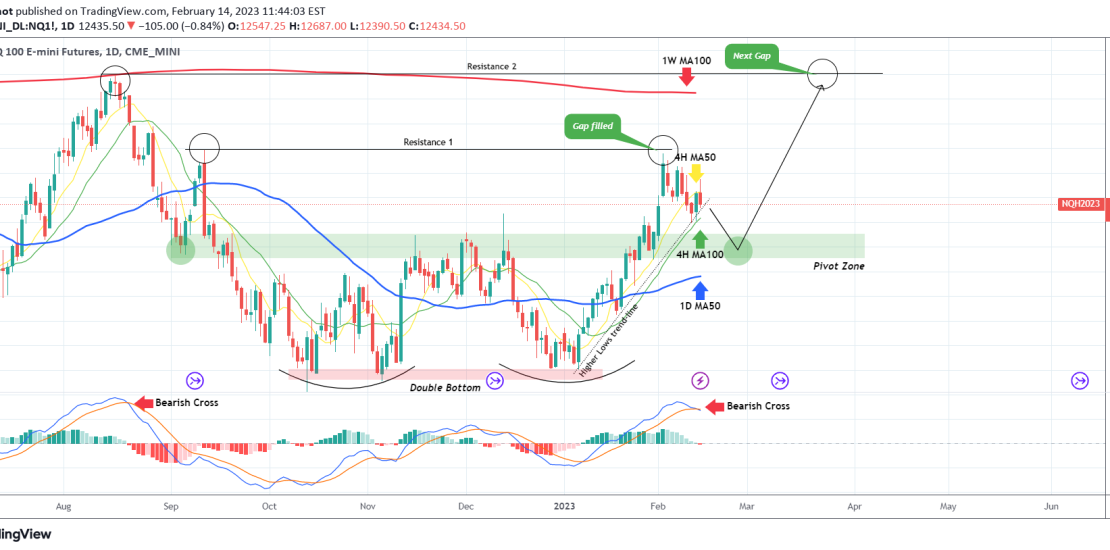
Nasdaq (NDX) broke above its 4H MA50 (yellow trend-line) today but following the U.S. CPI (higher than expected) is giving up the initial gains. We are closing the buy we made last week (as shown below) exactly at the short-term bottom on the Higher Lows trend-line in order to secure the short-term profit:

A closing below the 4H MA50 will be the first sell alert, confirmation of which would be a 1D candle close below the 4H MA100 (green trend-line) which has been supporting since January 10. The 1D MACD is already on a Bearish Cross. In that case we expect to see a test of the 1D MA50 (blue trend-line) inside the Pivot Zone.
That is the Zone that has made the most lows (rebounds) and highs (rejections) since September 2022. That would be the true test of the Double Bottom pattern formed on December 28, and if it holds, we expect a rebound towards the 1W MA100 (red trend-line).
It is interesting to point out the amazing symmetry of this pattern. As you see, Nasdaq already filled the first Gap on February 02 (from Resistance 1) and the next one is at 13750 (Resistance 2) slightly above the 1W MA100.
Tradingview link: