

- February 7, 2023
- Posted by: Tradingshot Articles
- Category: Stock Indices
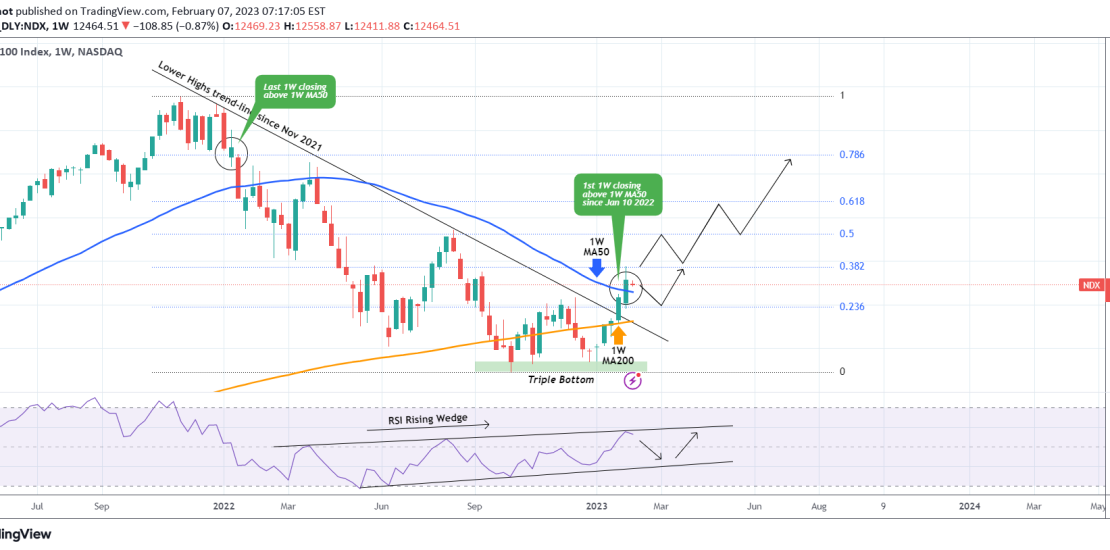
Nasdaq (NDX) closed last week above the 1W MA50 (blue trend-line) for the first time since the week of January 10 2022, so effectively for more than 1 year. On this analysis we diverge from our usual 4H – 1D time-frame analysis such as the recent one below, and look into the bigger picture on the 1W time-frame:

Having broken two weeks ago above the Lower Highs trend-line of the Bear Cycle, this 1W MA50 closing last week is the last of the bullish confirmations we need to validate that the long-term trend has changed.
With the price however rejected on the 0.382 Fibonacci retracement level, we may see a short-term pull-back, especially since the 1W RSI hit the top of the Rising Wedge that is holding since March. The Support Zone is now within the 0.236 Fib and the 1W MA200 (orange trend-line). If however the index closes above the 0.382 first, we expect a structured continuation of the recovery to at least the 0.786 Fib by the start of Q3. See how almost perfectly the Fib retracement levels match key Resistance and Support lines of the Bear Cycle. The market should treat them as demand/ supply zone on the way up too.
Tradingview link: