

- January 19, 2023
- Posted by: Tradingshot Articles
- Category: Stock Indices
The Dow Jones Industrial Average (DJI) followed our previous call (almost) 3 weeks ago to perfection as after trading within the Triangle, it broke to the upside and hit the 34300 target:

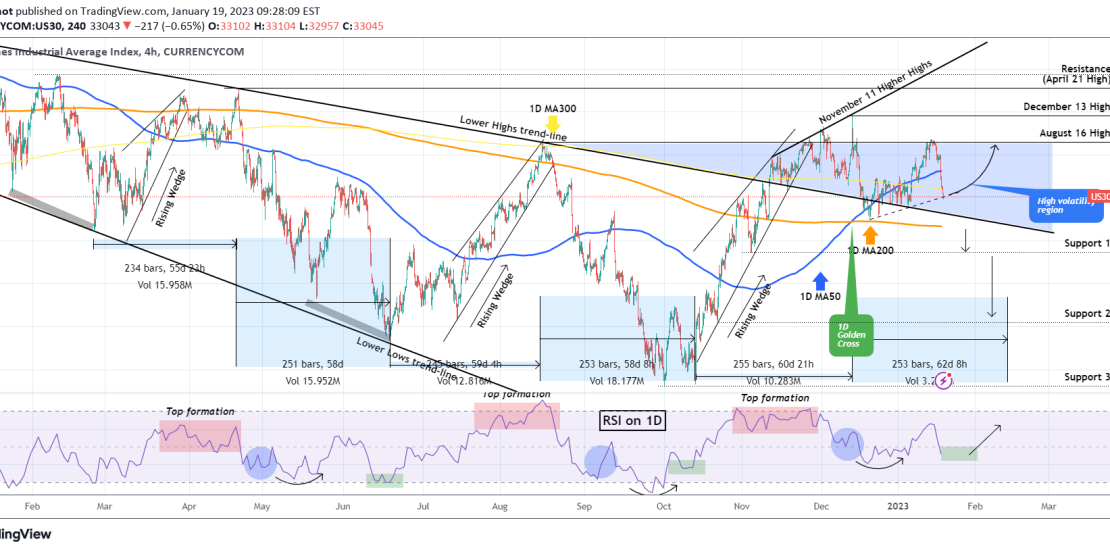
The strong rejection of this week simply validates the argument that we’ve made since November, that the blue zone will be a High Volatility region for Dow as it is a confluence of major Support (Bear Cycle Lower Highs trend-line), Resistance (34300 August 16 High) and MA levels (1D MA300 and 1D MA50 (yellow and blue trend-lines respectively)).
It is now testing the (dashed) Higher Lows trend-line, which if successful can make another trip to 34300. But if it doesn’t hold, the real medium-term Support Zone is within the former Lower Highs trend-line and (mostly) the 1D MA200 (orange trend-line), which has already held once successfully on December 20. A break below targets the 31725 Support (1) first and (on a much less likely scenario) the 30100 Support (2) in extension.
But why give away our 1D RSI blue-print and the symmetricality of each bullish – bearish phase that has been holding exceptionally well since the February 24 2022 bottom? As we explained in detail in our previous analysis, each bearish phase has been around 250 (4H) candles i.e. roughly 60 days. Considering that this is not a Bear Cycle bearish leg as it is obviously more sideways than making Lower Lows, we should be seeing an end of this phase by the 2nd week of February, if not earlier.
Based on the 1D RSI though, it has already started to form the bottoming process (green rectangle) as shown by the previous sequences. As a result, investors should be more patient with such drops and willing to buy the pull-back at this stage, than looking to short to Lower Lows.
Tradingview link: