
-
S&P500 Best buy signal since early January.
- March 20, 2023
- Posted by: Tradingshot Articles
- Category: Stock Indices
No Comments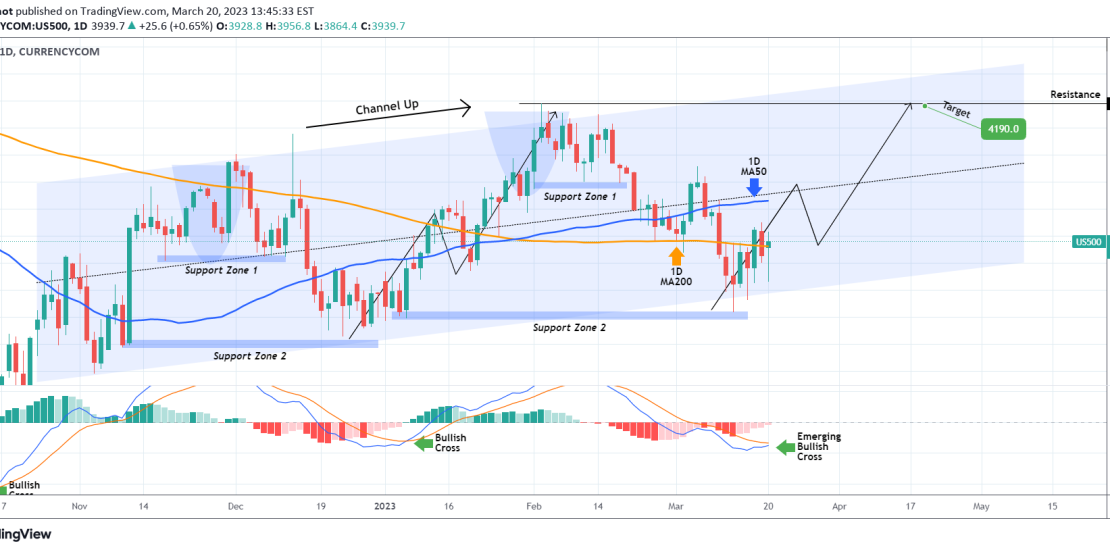
The S&P500 index (SPX) is on a 1 week rebound following the March 13 Low which was made on Support Zone 2 and is so far on the bottom of the 5-month Channel Up. All candles have closed inside this pattern and as you see so far every bearish and bullish wave follows similar structure
-
S&P500 Best buy signal since early January.
- March 20, 2023
- Posted by: Tradingshot Articles
- Category: Stock Indices

The S&P500 index (SPX) is on a 1 week rebound following the March 13 Low which was made on Support Zone 2 and is so far on the bottom of the 5-month Channel Up. All candles have closed inside this pattern and as you see so far every bearish and bullish wave follows similar structure
-
NASDAQ flipped the Bear Cycle and the 1D MA200 is now supporting
- March 17, 2023
- Posted by: Tradingshot Articles
- Category: Stock Indices
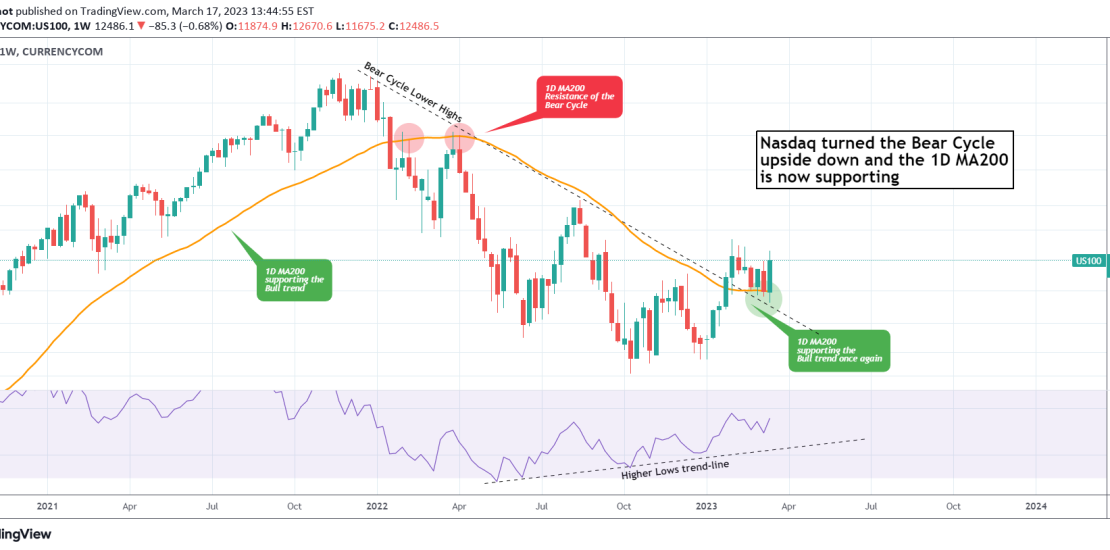
Nasdaq (NDX) rebounded yet another week on the Bear Cycle Lower Highs trend-line and has recovered all the losses of the previous three. On top of that, this is the 7th straight 1W candle close above the 1D MA200 (orange trend-line), which as you see on this 1W chart, it was been the Resistance during
-
DOW JONES is forming a bottom, aiming at the 1D MA50 again.
- March 16, 2023
- Posted by: Tradingshot Articles
- Category: Stock Indices
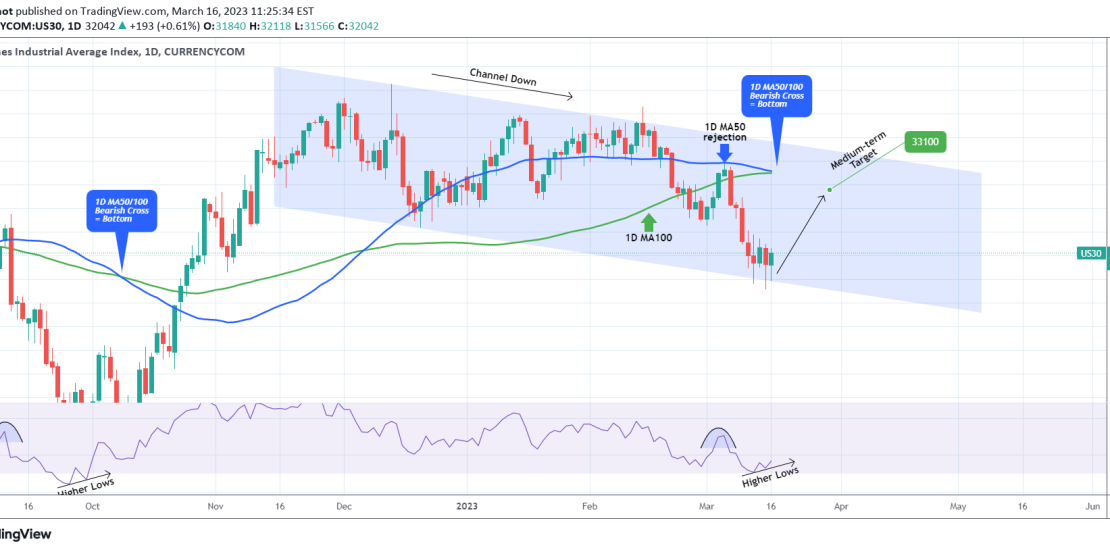
Dow Jones (DJI) is trading sideways for the 4th straight 1D candle on the bottom (Lower Lows trend-line) of the long-term Channel Down. As the 1D RSI touched the 30.00 oversold level and rebounded, similar to the September 27 bottom, while the 1D MA50 (blue trend-line) crossed below the 1D MA100 (green trend-line) to form
-
S&P500 is accumulating for a 2 year rally to 5700.
- March 14, 2023
- Posted by: Tradingshot Articles
- Category: Stock Indices
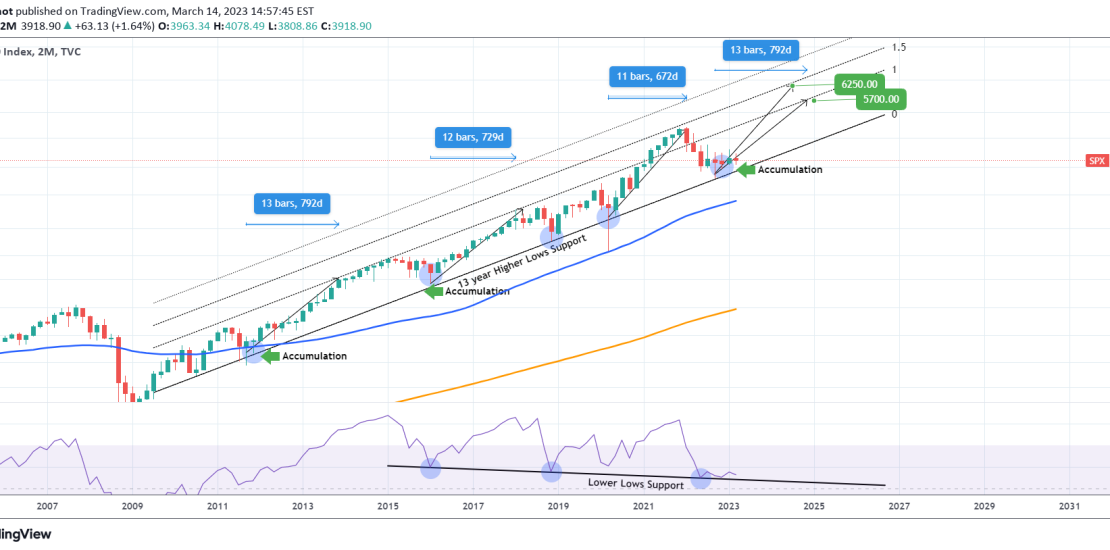
We have showed you this multi-year Channel Up on the S&P500 index (SPX) before. We have shown you the Lower Lows Support of the 2M RSI that has caught all major bottoms since 2016. What this chart shows is that the index has bottomed on the Channel’s Higher Lows (a 13 year trend-line) and is
-
DOW JONES Don’t get confused.It’s starting a new multiyear rally
- March 14, 2023
- Posted by: Tradingshot Articles
- Category: Stock Indices
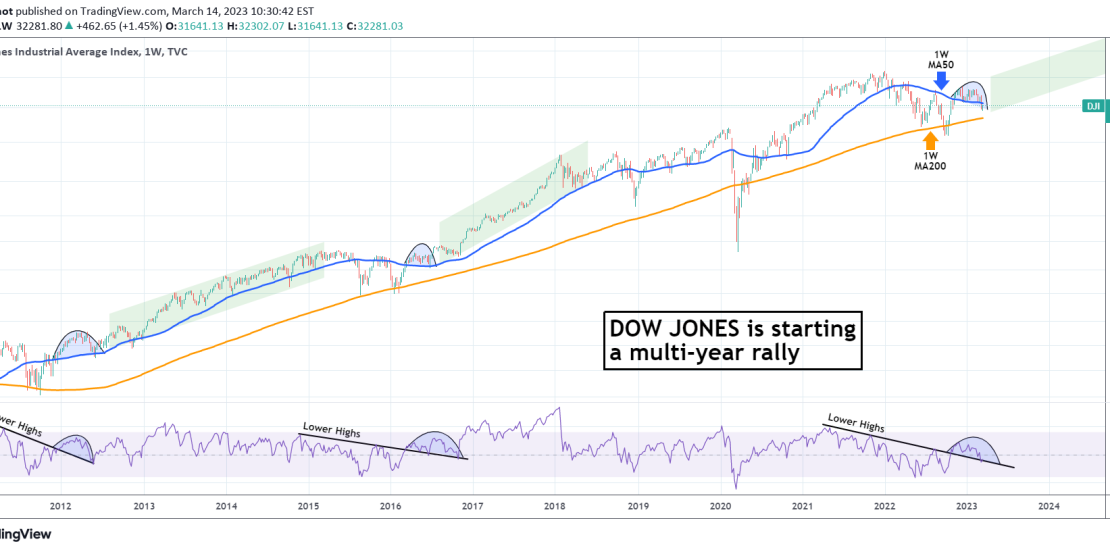
This is a chart we’ve looked into in the recent past for Dow Jones (DJI) but amidst the recent uncertainty, we think it is necessary to refresh in order to keep things into a longer term perspective. The time-frame is the 1W (weekly) where Dow is seen forming an Arc pattern on the 1W MA50
-
S&P500 is a perfect buy here long-term in this Cup pattern.
- March 10, 2023
- Posted by: Tradingshot Articles
- Category: Stock Indices
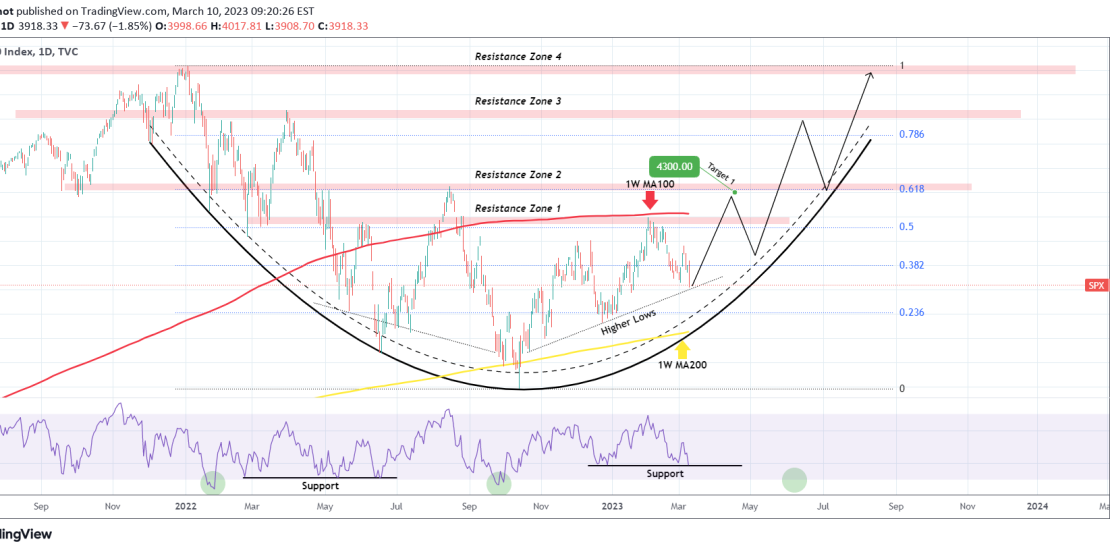
The S&P500 is on a medium-term correction following the February 02 rejection just below the 1W MA100 (red trend-line). The long-term pattern is a Cup formation and the price is approaching its buy Zone. Right now though it sits on the Higher Lows trend-line that has formed the medium-term Channel Up and is an ideal
-
S&P500 The huge Inverse H&S has started and its target is 4700!
- March 6, 2023
- Posted by: Tradingshot Articles
- Category: Stock Indices
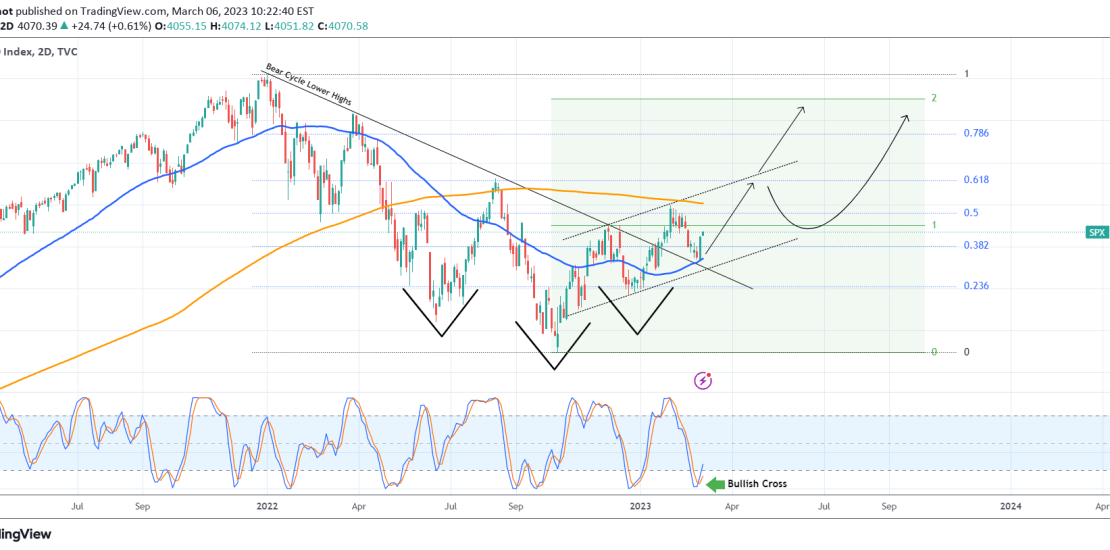
Last week we have made clear our short/ medium-term view on the S&P500 (SPX), calling a buy on the exact bottom of the Channel Up: It is time to look again, as we normally do on a monthly basis, on the bigger picture, looking at the 2D time-frame. The Channel Up is clear and so
-
NASDAQ Its weekly Pivot closing determines the long-term trend
- March 2, 2023
- Posted by: Tradingshot Articles
- Category: Stock Indices
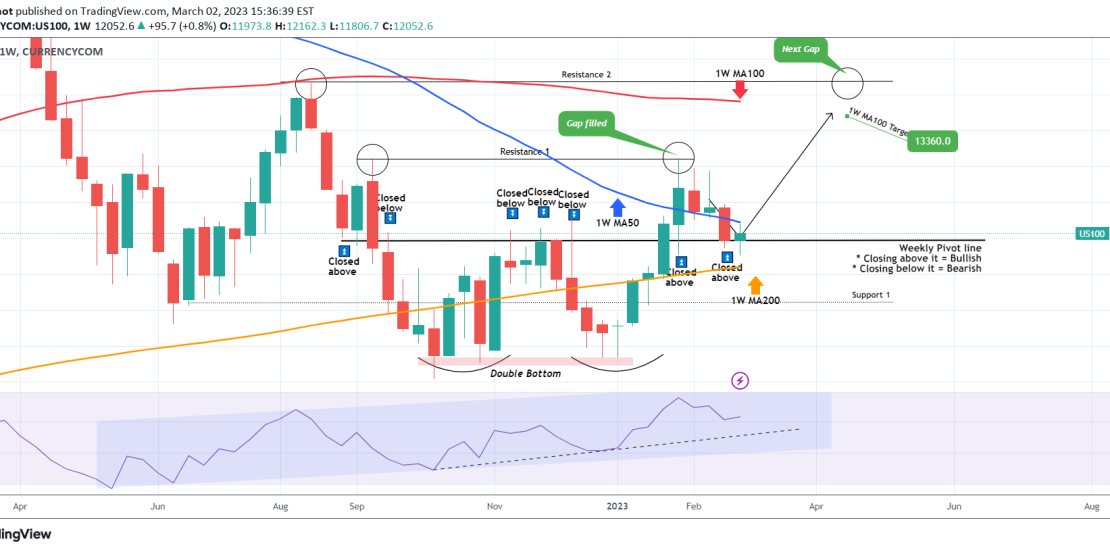
Last week we looked into Nasdaq (NDX) from a 1D perspective, giving emphasis on the important of the 1D MA200 and 1D MA50 as Supports, giving emphasis on the Pivot Zone involved since September: It is important now to show you why this level is important for the long-term, this time on the 1W time-frame.
-
S&P500 Bottom by tomorrow, slow 2-week recovery after.
- March 1, 2023
- Posted by: Tradingshot Articles
- Category: Stock Indices
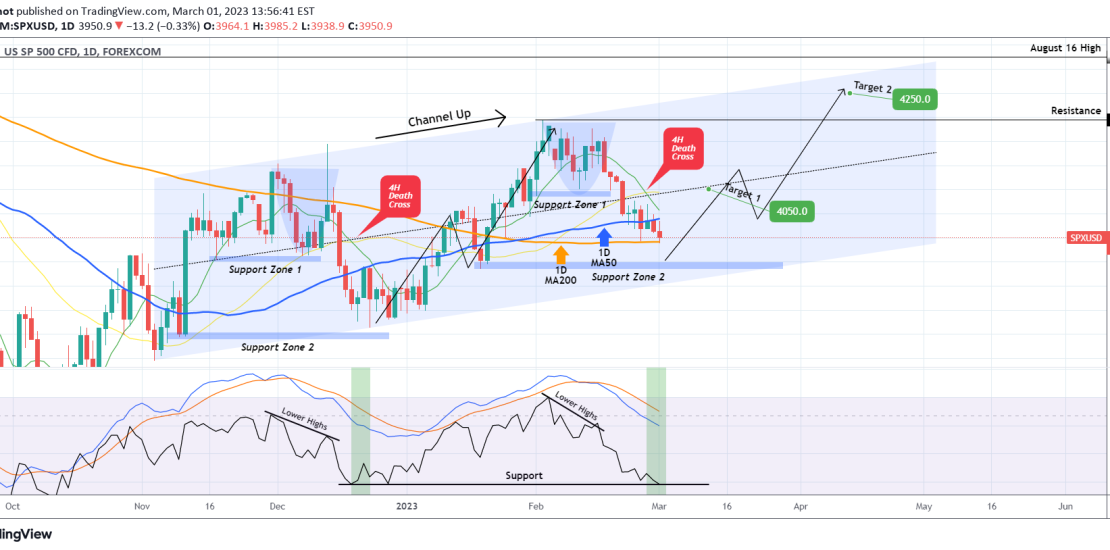
The S&P500 index (SPX) is trading between its 1D MA50 (blue trend-line) and 1D MA200 (orange trend-line) ad the long-term Channel Up pattern that started on the November 03 Low is attempting to price its new Lower High. Based on the symmetry provided by the 1D RSI that is on the 39.00 Support (Dec 19
