

- March 14, 2023
- Posted by: Tradingshot Articles
- Category: Stock Indices
This is a chart we’ve looked into in the recent past for Dow Jones (DJI) but amidst the recent uncertainty, we think it is necessary to refresh in order to keep things into a longer term perspective.
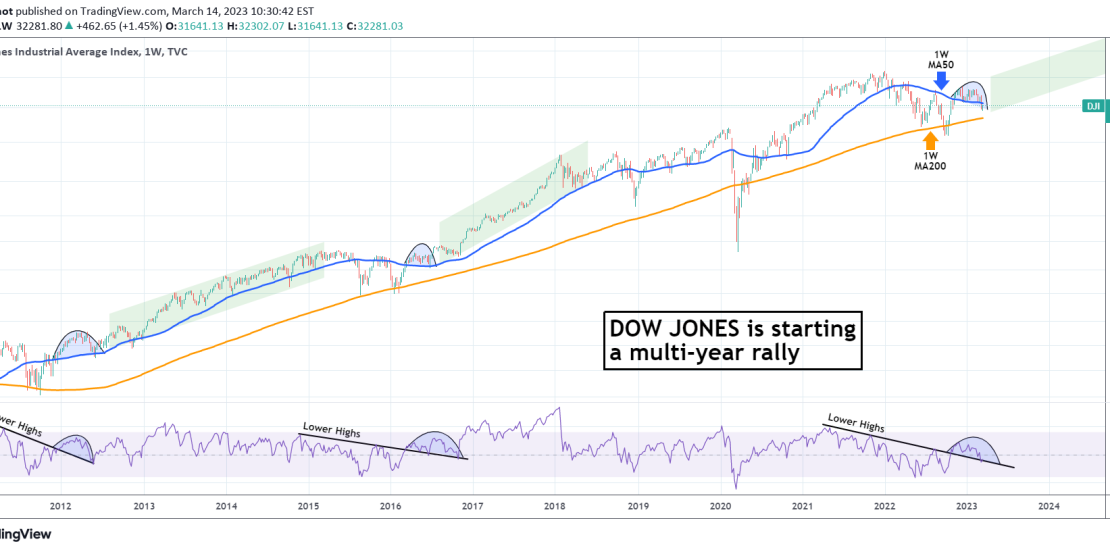
The time-frame is the 1W (weekly) where Dow is seen forming an Arc pattern on the 1W MA50 (blue trend-line), which since the 2009 housing crisis bottom, has formed every time it corrected on the 1W MA200 (orange trend-line) and rebounded (excluding of course the March 2020 COVID crash). On both of these occasions, this Arc pattern was an Accumulation Phase before a new multi-year rally.
The 1W RSI is also on a familiar pattern with those prior fractals, forming an Arc construct on a Lower Highs trend-line. Is this the final accumulation before Dow starts a new multi-year rally?
Tradingview link: