

- March 2, 2023
- Posted by: Tradingshot Articles
- Category: Stock Indices
Last week we looked into Nasdaq (NDX) from a 1D perspective, giving emphasis on the important of the 1D MA200 and 1D MA50 as Supports, giving emphasis on the Pivot Zone involved since September:

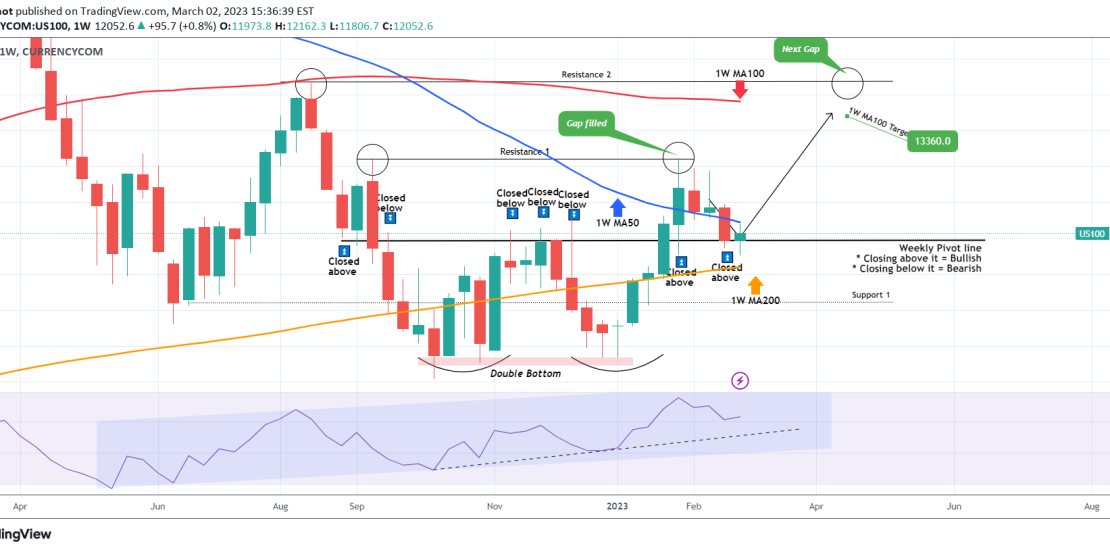
It is important now to show you why this level is important for the long-term, this time on the 1W time-frame. As you see on the current chart, despite last week’s sell-off, Nasdaq closed its 1W candle exactly on the Weekly Pivot line. This is the line that separates the bullish from the bearish trend. As long as the price closes above it, the trend is bullish and vice versa if it closes below it, the trend is bearish. It is therefore critical to see where the 1W candle will close tomorrow.
The 1W RSI shows us a steady rise, indicating that we are technically outside of the Bear Market. The October – November Double Bottom managed to fil the 1st Gap on Resistance 1 (12885) and if the 1W candle closes above the Pivot line, we expect this pattern to fill the Gap on Resistance 2, but as with our usual low risk approach, we set a Target lower on a potential 1W MA100 (red trend-line) contact at 13360.
If the 1W candle closes below the pivot, expect the 1W MA200 (orange trend-line) to be tested and then the lower symmetrical Support at 11280.
Tradingview link: