

- March 1, 2023
- Posted by: Tradingshot Articles
- Category: Stock Indices
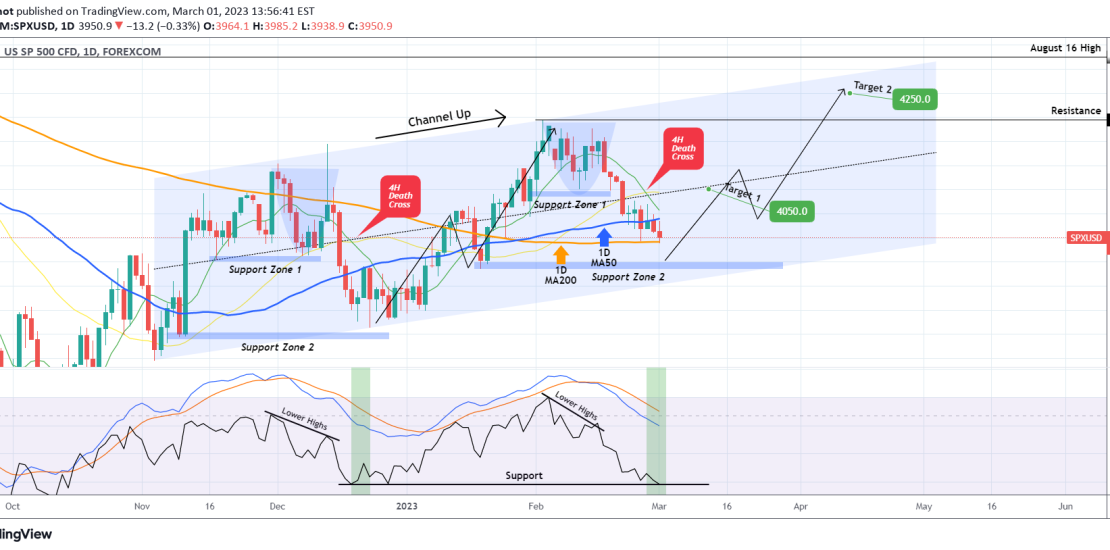
The S&P500 index (SPX) is trading between its 1D MA50 (blue trend-line) and 1D MA200 (orange trend-line) ad the long-term Channel Up pattern that started on the November 03 Low is attempting to price its new Lower High.
Based on the symmetry provided by the 1D RSI that is on the 39.00 Support (Dec 19 and Dec 28 Double Bottom), the 1D MACD and and 4H Death Cross (February 27 and December 19), the current sequence is extremely similar with the December 19 – 22 bottom fractal. That was basically the previous Higher Low of the Channel Up. The 4H MA50 (green trend-line) is about to cross tomorrow below the 1D MA50 and that marked the exact previous bottom on December 22.
As a result, this is the most optimal long-term buy level, and we are targeting initially at 4050 (middle of the Channel Up) and 4250 (just below the Higher Highs trend-line) in extension.
Tradingview link: