
-
Can the market rise more during Biden’s Presidency than Trump’s?
- November 16, 2020
- Posted by: Tradingshot Articles
- Category: Stock Indices
No Comments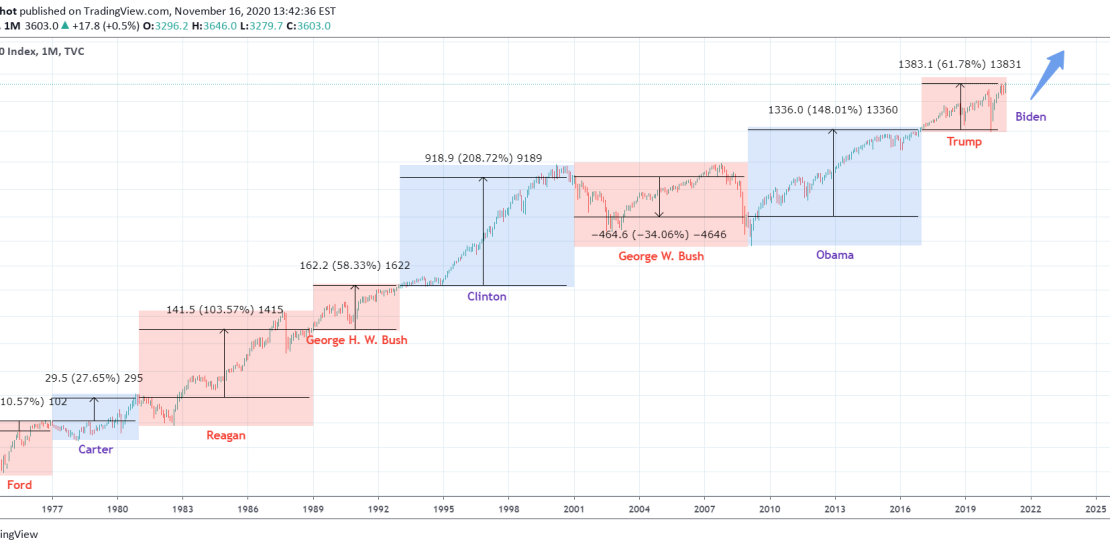
This is a simple chart showing the performance of the S&P500 under each President since the Ford administration is 1974. As you see contrary to popular belief, the stock market in modern times has done (much) better under a Democrat President. Bill Clinton has had the strongest performance with more than +200% in gains
-
S&P500 Buy Signal / Strong supporting line
- November 11, 2020
- Posted by: Tradingshot Articles
- Category: Stock Indices
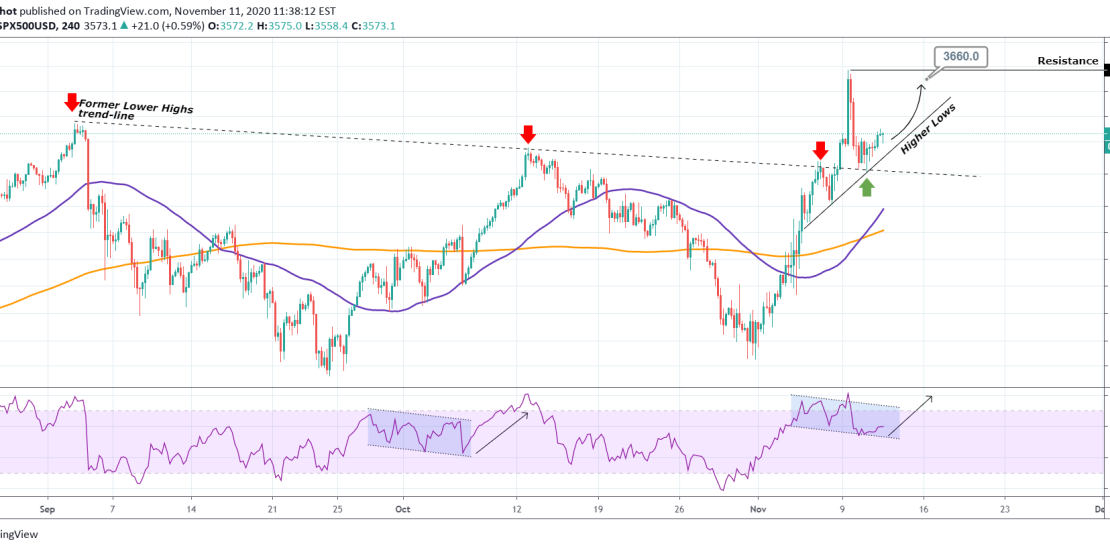
Pattern: Higher Lows on the 4H chart. Signal: Buy as the index rebounded not only on the former Lower Highs trend-line (dashed line), but also on the newly formed Higher Lows trend-line. Target: 3660 (just below the 3675 Resistance). Recent S&P signals: ** Please support this idea with your likes and comments, it
-
DAX Buy Signal
- November 9, 2020
- Posted by: Tradingshot Articles
- Category: Stock Indices
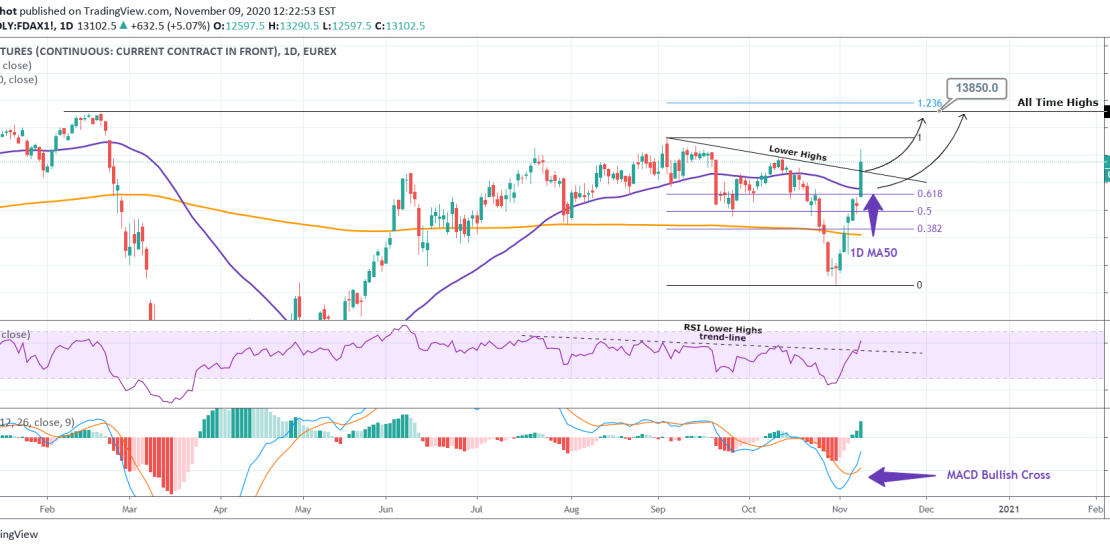
Pattern: Lower Highs bullish break-out. Signal: Buy as the RSI broke above its 3 month Lower Highs trend-line and the MACD is on a Bullish Cross much below the mean. Target: 13850 (within the ATH and 1.236 Fib extension line). Most recent DAX signal: ** Please support this idea with your likes and comments,
-
S&P500 Time to break above the Stimulus-Elections Triangle?
- November 5, 2020
- Posted by: Tradingshot Articles
- Category: Stock Indices

Since the September 03 Top (All Time High), S&P500 has entered a volatile pattern in the form of a Triangle. The major drivers of this weakness have fundamentally been the U.S. stimulus being delayed and then the elections. Today the Lower Highs trend-line of this Triangle is being tested. If broken, I expect the
-
S&P500 The elections can kickstart a +30% yearly rally!
- November 4, 2020
- Posted by: Tradingshot Articles
- Category: Stock Indices
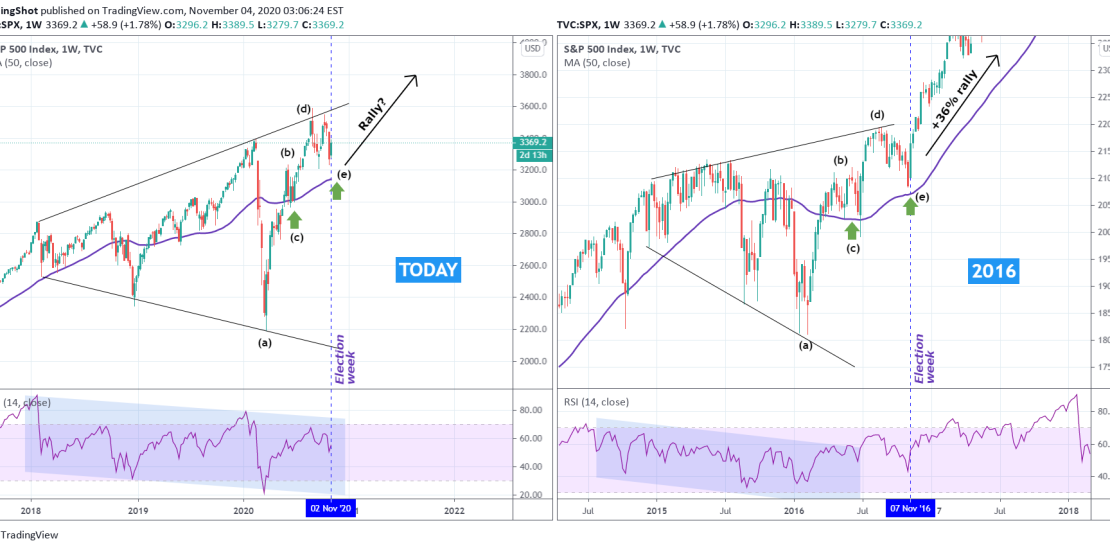
The chart comparison doesn’t need much explaining. I compare the price action on the 1W time-frame that led to the 2016 actions with today’s sequence. Both patterns are Megaphones on a descending RSI with the 1W MA50 (blue trend-line) acting as a Support on the Megaphones late stage. On the November 07 2016 1W
-
DOW JONES targeting 28650
- November 3, 2020
- Posted by: Tradingshot Articles
- Category: Stock Indices
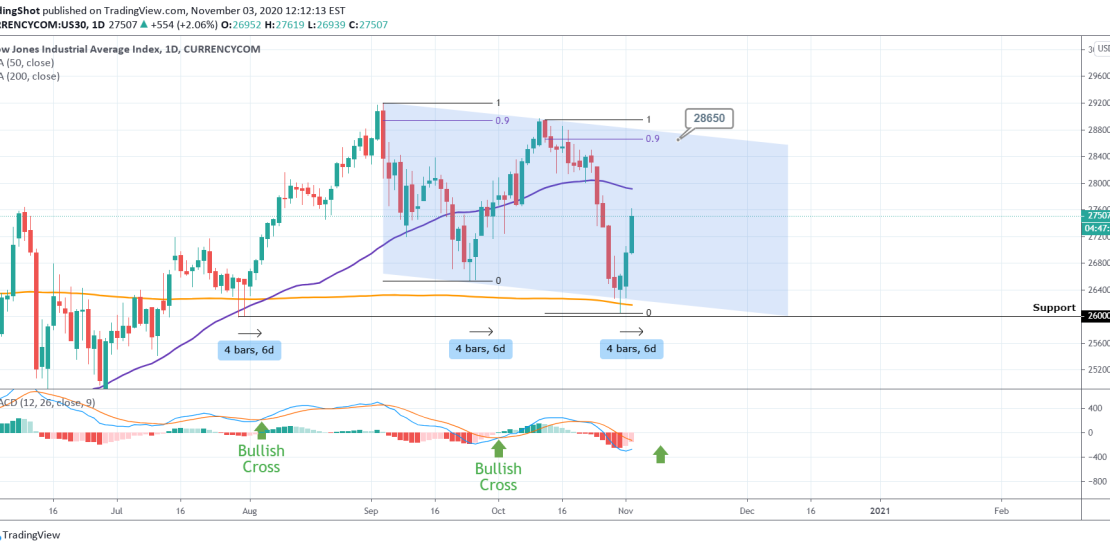
Dow rebounded 3 days ago on the 1D MA200 (orange trend-line). Since late July, this trend-line has been holding firmly as Support and every contact (with a candle week, no candle closing has been done below it), has resulted in a strong rise. Since the pattern is a Channel Down currently (since the September
-
S&P500 targeting 3500
- November 3, 2020
- Posted by: Tradingshot Articles
- Category: Stock Indices
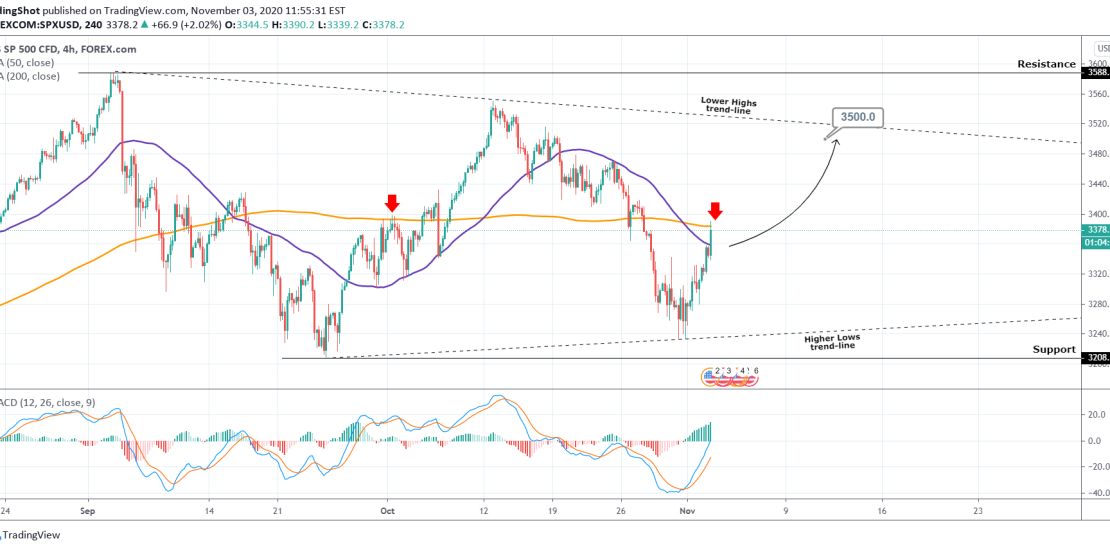
Pattern: Triangle on 4H. Signal: Buy on the next MA50 contact as the price breached the 4H MA200 as in October 01. Also the MACD made a strong Bullish Cross, similar in strength with the September 24 – 29. Target: 3500 (potential contact on the Lower High trend-line of the pattern). Most recent S&P
-
DAX targeting 13000 if the 1D MA200 breaks (3 year pattern)
- November 3, 2020
- Posted by: Tradingshot Articles
- Category: Stock Indices
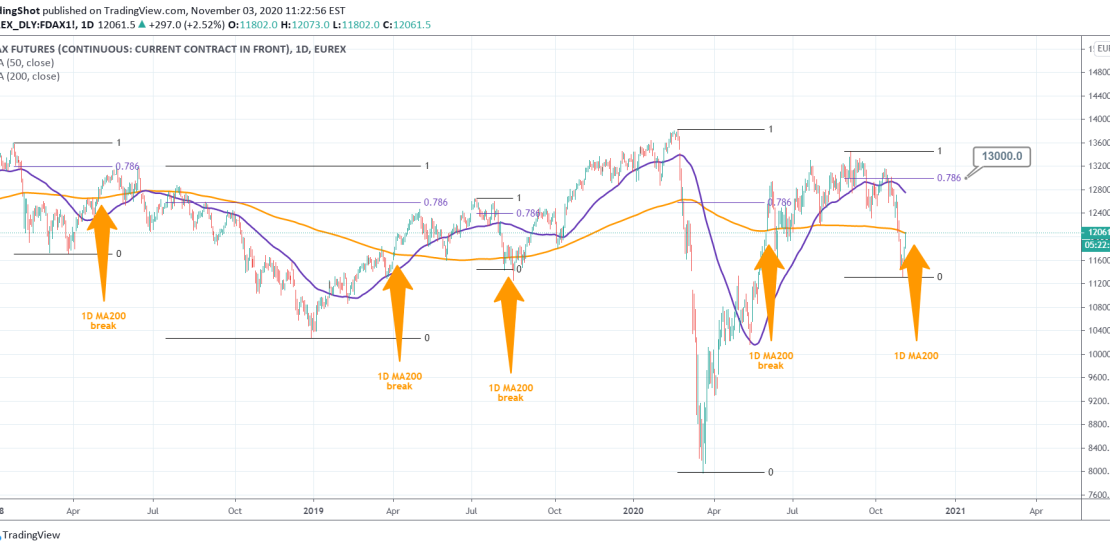
This is an interesting 3 year pattern for DAX. Since 2018, every time the 1D MA200 breaks as a Resistance (index closes one 1D candle above it), DAX rallies to at least the 0.786 Fibonacci retracement level of the previous Top. Right now we are testing the 1D MA200 and the 0.786 is at
-
DOW JONES Recurring bullish pattern on the 1W time-frame?
- October 23, 2020
- Posted by: Tradingshot Articles
- Category: Stock Indices
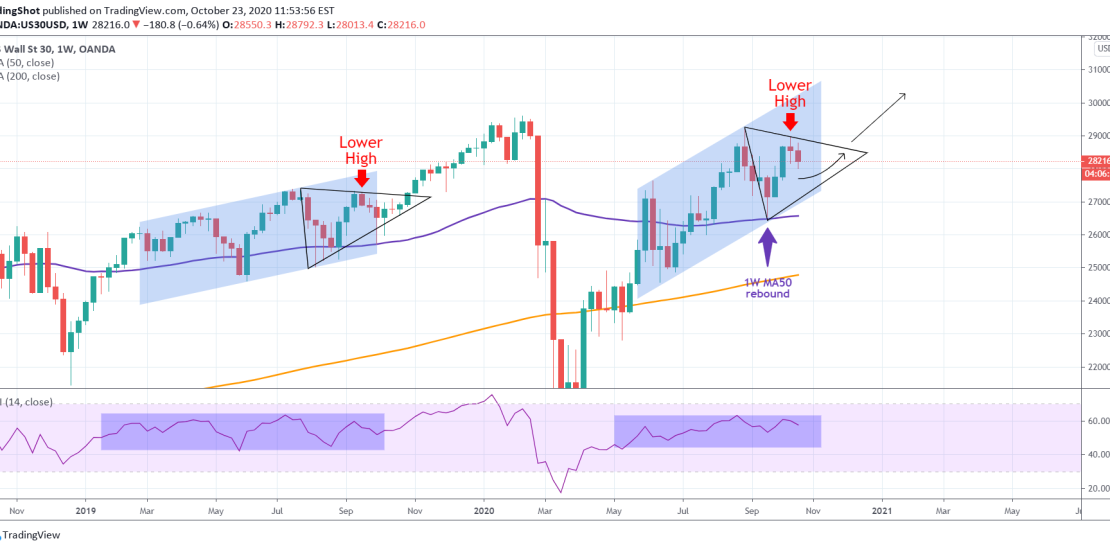
The Channel Up since June has fairly the same basic structure (even though more aggressive) than the one from March to September 2019, which led to the pre-COVID All Time High. That pattern ended with a Lower High than created a Triangle, which eventually broke to the upside to the ATH. Dow Jones made
-
S&P500 Why do you keep ignoring the 4H MA50?
- October 7, 2020
- Posted by: Tradingshot Articles
- Category: Stock Indices
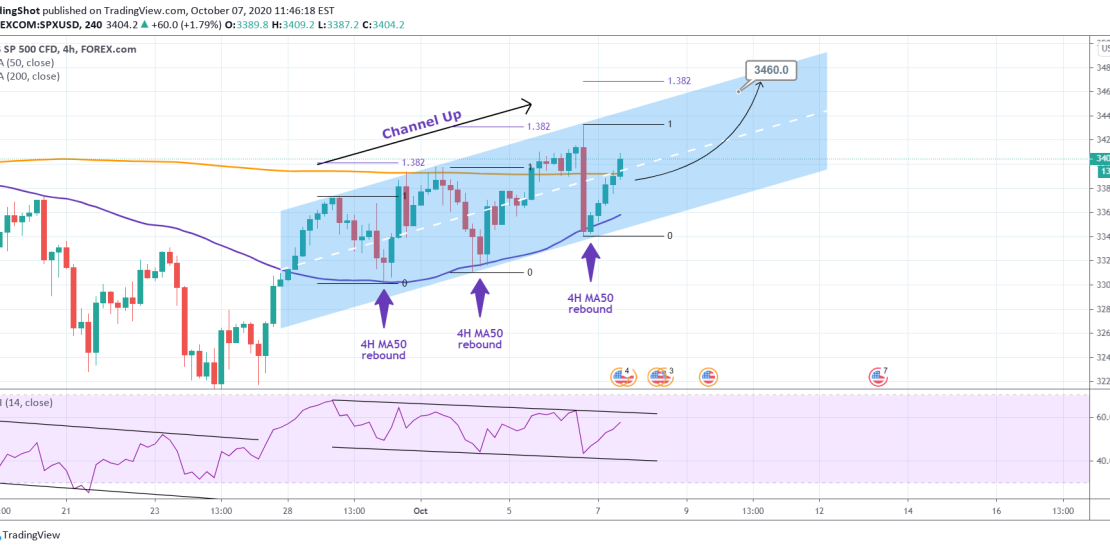
Isn’t that true? Since the index broke above it on September 28, the MA50 on the 4H chart has been the most reliable buy entry you could get. So far (counting yesterday) this happened three times. I’ve mentioned this potential on a few studies with the most recent one as seen below: Technically every
