

- November 4, 2020
- Posted by: Tradingshot Articles
- Category: Stock Indices
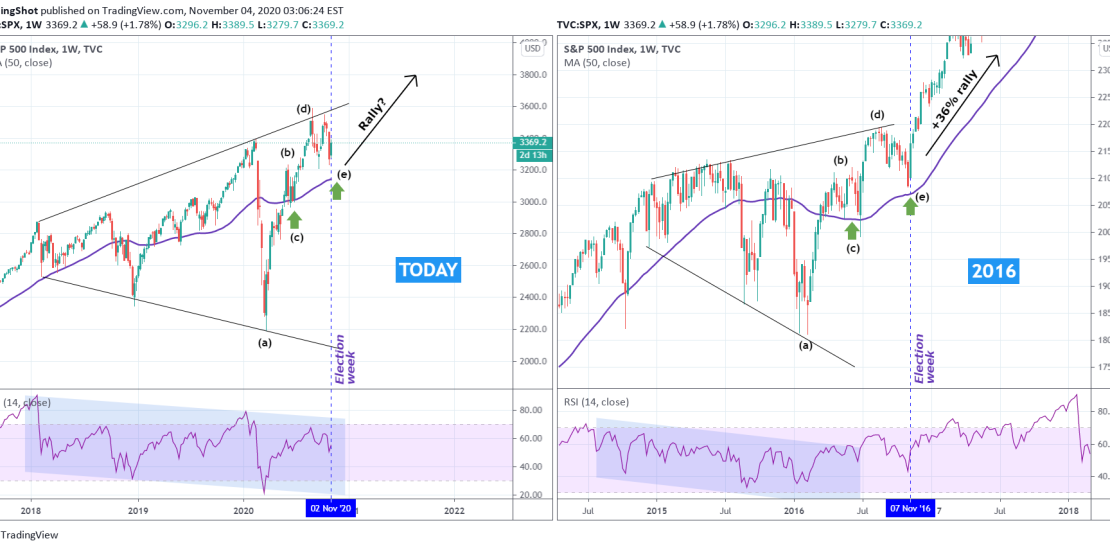
Both patterns are Megaphones on a descending RSI with the 1W MA50 (blue trend-line) acting as a Support on the Megaphones late stage. On the November 07 2016 1W candle, S&P rebounded, starting a non-stop rally that didn’t give any important pull-back until January 2018, achieving a +36% rise!
Can S&P rebound on this week’s election candle, completing the (e) leg?
Feel free to share your work and let me know in the comments section!
Please like, subscribe and share your ideas and charts with the community!
——————————————————————————————————–
!! Donations via TradingView coins also help me a great deal at posting more free trading content and signals here !!
🎉 👍 Shout-out to TradingShot’s 💰 top TradingView Coin donor 💰 this week ==> didogetsov
——————————————————————————————————–