

- October 23, 2020
- Posted by: Tradingshot Articles
- Category: Stock Indices
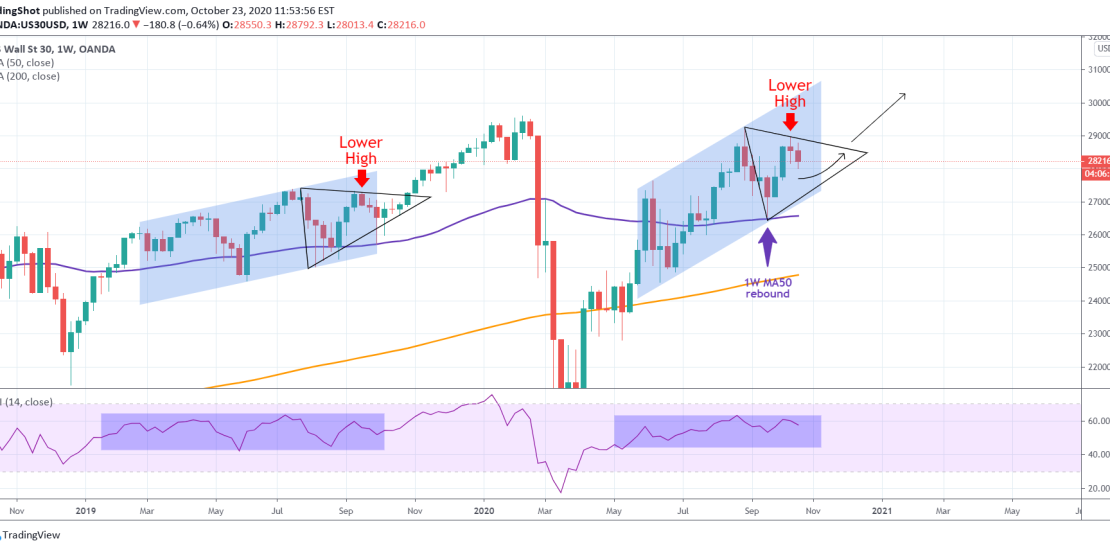
The Channel Up since June has fairly the same basic structure (even though more aggressive) than the one from March to September 2019, which led to the pre-COVID All Time High.
That pattern ended with a Lower High than created a Triangle, which eventually broke to the upside to the ATH. Dow Jones made that Lower High last week. See also how the RSI consolidated during both Channels.
The index has already defended the 1W MA50 (blue trend-line) with a perfect bounce last month. Is this Triangle ready to break to new Highs next month? Feel free to share your work and let me know in the comments section!
Please like, subscribe and share your ideas and charts with the community!
——————————————————————————————————–
!! Donations via TradingView coins also help me a great deal at posting more free trading content and signals here !!
🎉 👍 Shout-out to TradingShot’s 💰 top TradingView Coin donor 💰 this week ==> TradingView
——————————————————————————————————–
Tradingview link: