

- October 7, 2020
- Posted by: Tradingshot Articles
- Category: Stock Indices
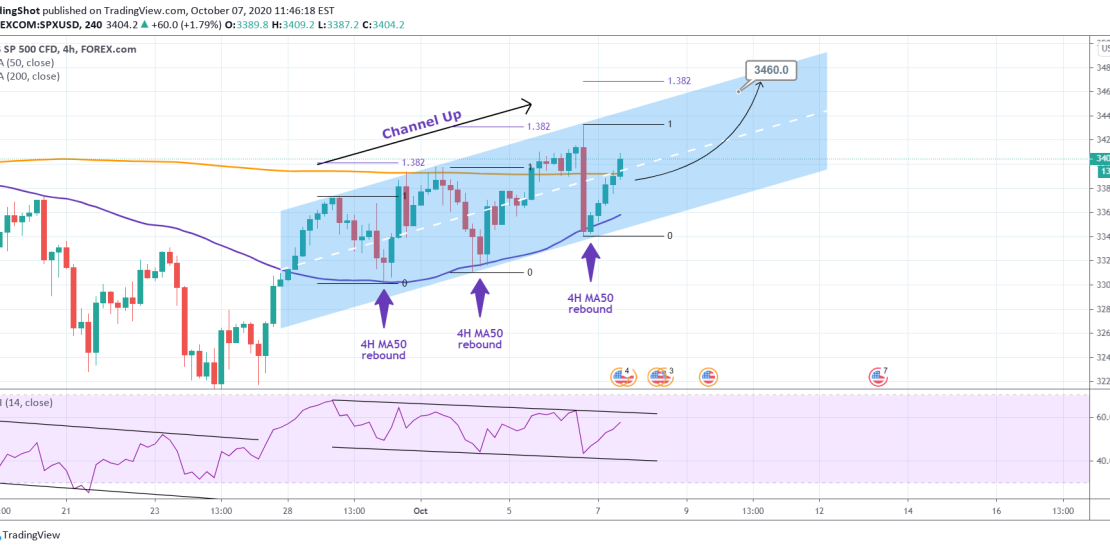
Isn’t that true? Since the index broke above it on September 28, the MA50 on the 4H chart has been the most reliable buy entry you could get. So far (counting yesterday) this happened three times. I’ve mentioned this potential on a few studies with the most recent one as seen below:

Technically every Higher High on this Channel Up is on the 1.382 Fibonacci extension of the previous High. See how consistent this has been on two occasions. This sets the target at 3460.
Based on a recurring RSI sequence (Channel Down accumulation into a strong bullish break-out), the price may be preparing an even stronger jump.
Don’t lose sight of the greater picture:

Are you gonna keep ignoring the 4H MA50? Feel free to share your work and let me know in the comments section!
Please like, subscribe and share your ideas and charts with the community!
——————————————————————————————————–
!! Donations via TradingView coins also help me a great deal at posting more free trading content and signals here !!
🎉 👍 Shout-out to TradingShot’s 💰 top TradingView Coin donor 💰 this week ==> Hunchocrypto1
——————————————————————————————————–
Tradingview link:
https://www.tradingview.com/chart/SPXUSD/0IpSmsVJ-S-P500-Why-do-you-keep-ignoring-the-4H-MA50