

- November 3, 2020
- Posted by: Tradingshot Articles
- Category: Stock Indices
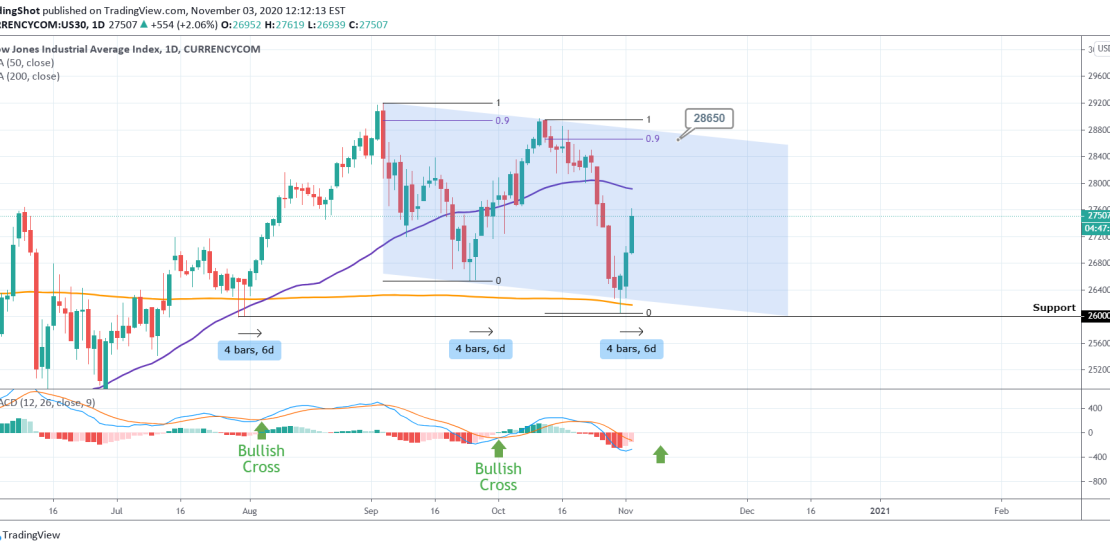
Dow rebounded 3 days ago on the 1D MA200 (orange trend-line). Since late July, this trend-line has been holding firmly as Support and every contact (with a candle week, no candle closing has been done below it), has resulted in a strong rise.
Since the pattern is a Channel Down currently (since the September 03 High) is is natural to target the Lower High trend-line. As seen on the chart, the previous Lower High was made on the 0.9 Fibonacci retracement level, which is currently at 28650.
Bonus: see how every MA200 bottom gave 4 days to the MACD to make a Bullish Cross on the last two occasions. That means that by Thursday the 1D MACD will make a Bullish Cross.
** Please support this idea with your likes and comments, it is the best way to keep it relevant and support me. **
——————————————————————————————————–
!! Donations via TradingView coins also help me a great deal at posting more free trading content and signals here !!
🎉 👍 Shout-out to TradingShot’s 💰 top TradingView Coin donor 💰 this week ==> didogetsov
——————————————————————————————————–
Tradingview link:
https://www.tradingview.com/chart/US30/r17HpbF5-DOW-JONES-targeting-28650