
-
EURCAD Hit the 1D MA100 for the 1st time since February!
- September 19, 2022
- Posted by: Tradingshot Articles
- Category: Forex
No Comments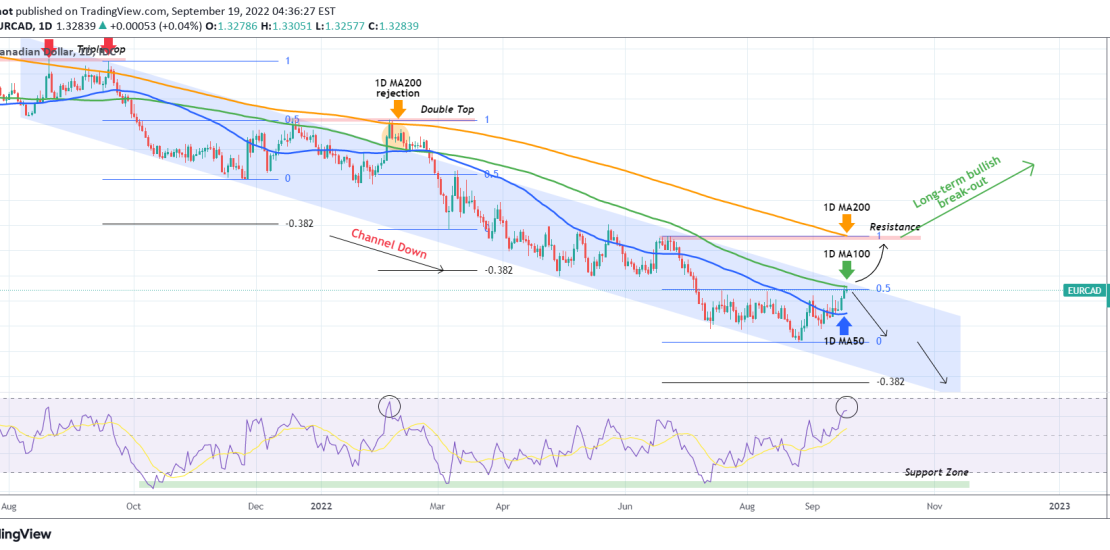
The EURCAD pair hit on Friday the 1D MA100 (green trend-line) for the first time since February 24. It just so happens that this contact is taking place at the top (Lower Highs trend-line) of the long-term Channel Down pattern that the pair has been trading in since mid August 2021. This level gives
-
CHFJPY One of the most consistent signals of the past 12 months.
- September 19, 2022
- Posted by: Tradingshot Articles
- Category: Forex
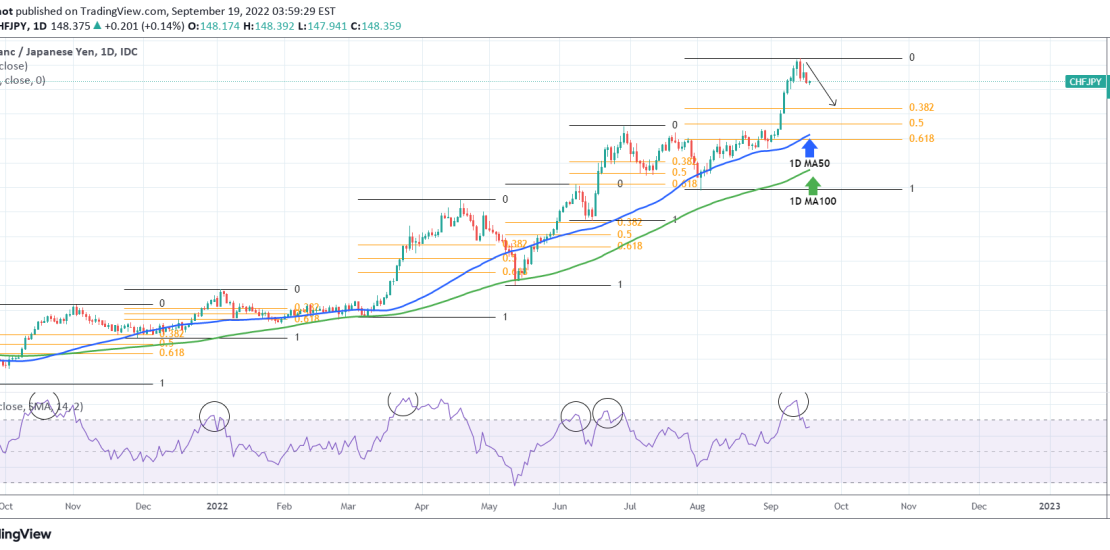
The CHFJPY pair has been pulling back after the September 13 High, following the impressive rally since the August 02 low. This pull-back is taking place after the 1D RSI broke the 80.00 heavily overbought barrier. On this 1D chart, you may notice that especially since October 20, 2021, every time the 1D RSI
-
DXY Two levels it can reverse massively on this 30 year Channel!
- September 15, 2022
- Posted by: Tradingshot Articles
- Category: Forex
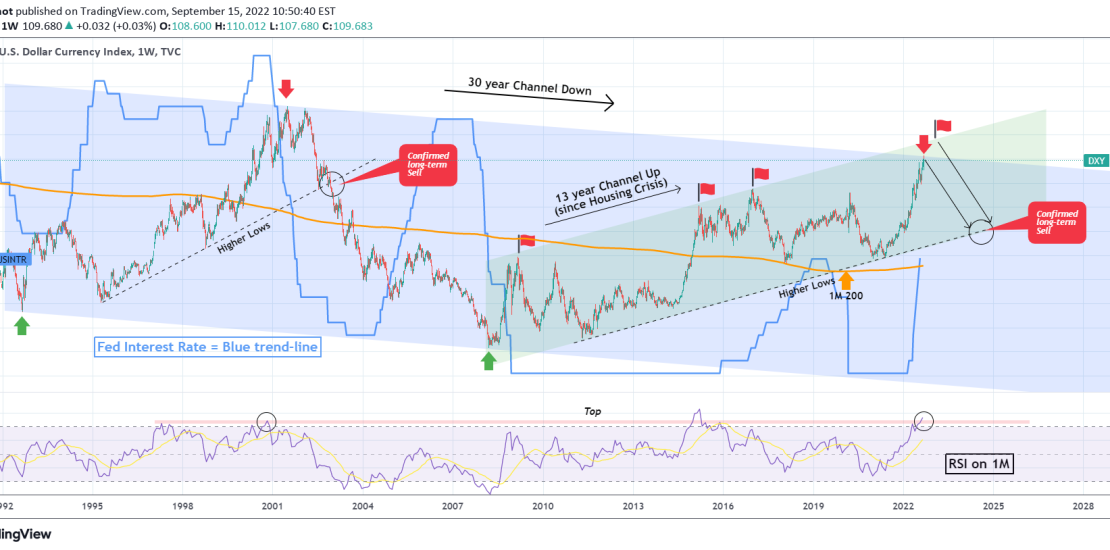
The U.S. Dollar Index (DXY) has been rising all year in the aftermath of the Fed to decide to raise the interest rates in their battle to lower the extreme levels of inflation. As a result, the USD has been gaining against the basket of major world currencies. From a technical perspective though, the
-
EURJPY Buy opportunity upon a pull-back.
- September 14, 2022
- Posted by: Tradingshot Articles
- Category: Forex
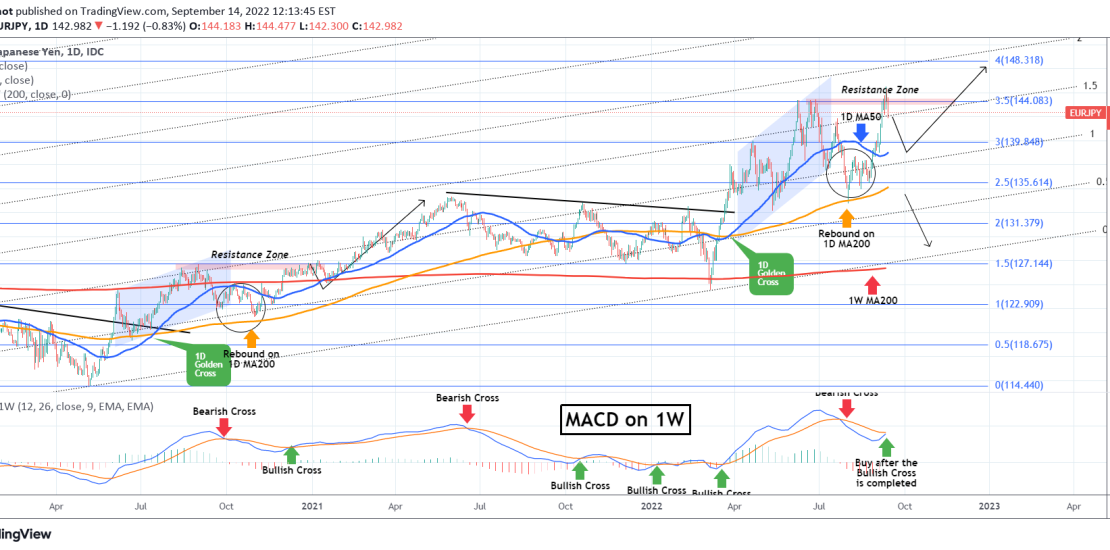
The EURJPY pair is pulling back currently after marginally breaking above the June Resistance Zone. This continues to repeat the fractal of 2020 as we pointed out in our last analysis: As you see the projection was correct as the price rebounded exactly on the 1D MA200 (orange trend-line) just like on November 02
-
EURUSD Breaking above the 7-month Channel Down.
- September 12, 2022
- Posted by: Tradingshot Articles
- Category: Forex
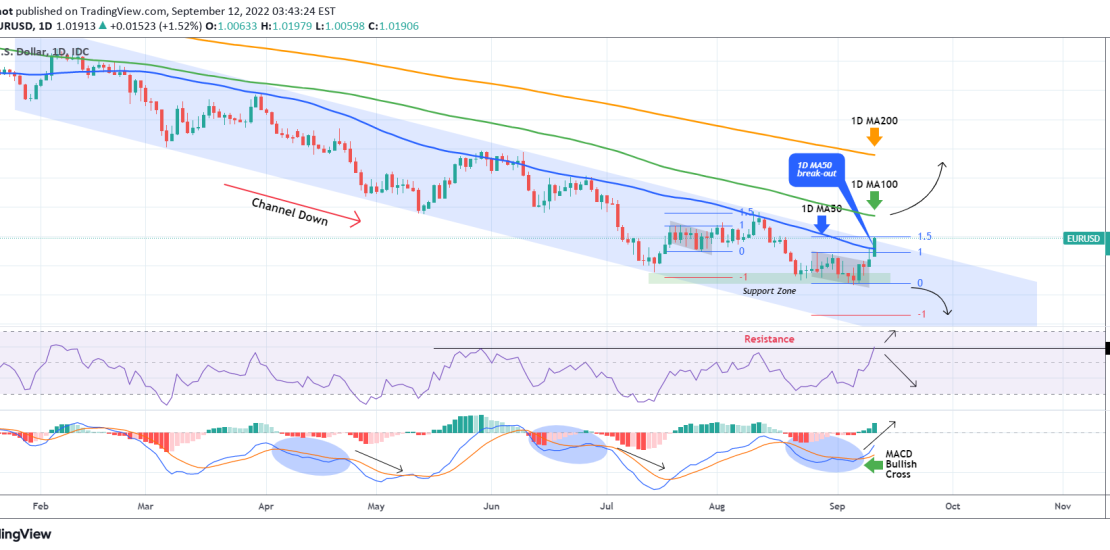
The EURUSD pair did as expected following our last analysis and as it held the 0.98700 Support, it rose aggressively and reached the 1.5 Fibonacci extension just like on the August 10 fractal: This time we are back to the 1D time-frame again as we have a much more important development in front of
-
USDZAR Critical Resistance. Levels to buy and sell.
- September 6, 2022
- Posted by: Tradingshot Articles
- Category: Forex
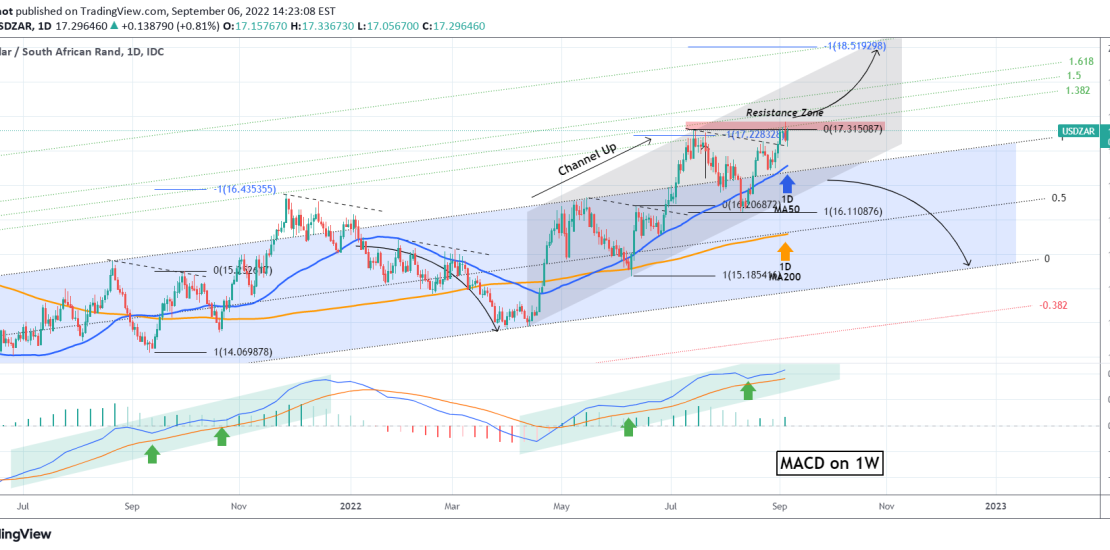
The USDZAR pair broke above its former Resistance Zone since our last analysis on June 29: The 1.382 Fibonacci extension target was hit and yet another break-out approach turned out to be successful. With the 1D MA50 (blue trend-line) supporting since August 17, we will continue to adopt a break-out trading perspective. A 1D
-
EURUSD Neutral within this zone. Consider those break-out levels
- September 6, 2022
- Posted by: Tradingshot Articles
- Category: Forex
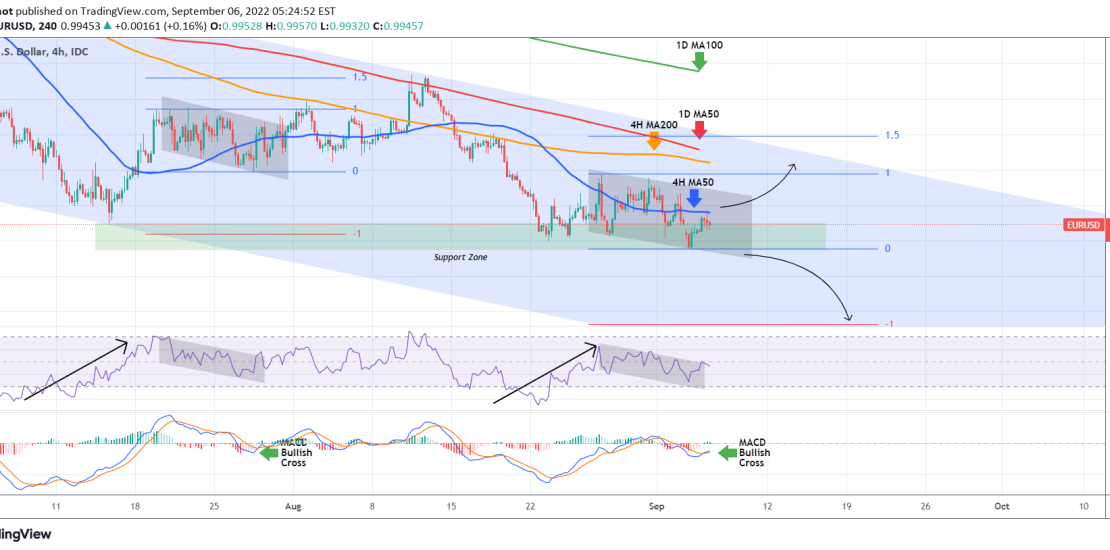
The EURUSD pair got rejected today on the 4H MA50 (blue trend-line) after attempting to make a rebound within the 1.5 month Support Zone. The RSI and MACD patterns on the 4H time-frame are similar to the Bull Flag formation of July 19 – 27, where the RSI was inside a Channel Down and
-
USDMXN Consolidation until the next break upwards.
- September 2, 2022
- Posted by: Tradingshot Articles
- Category: Forex
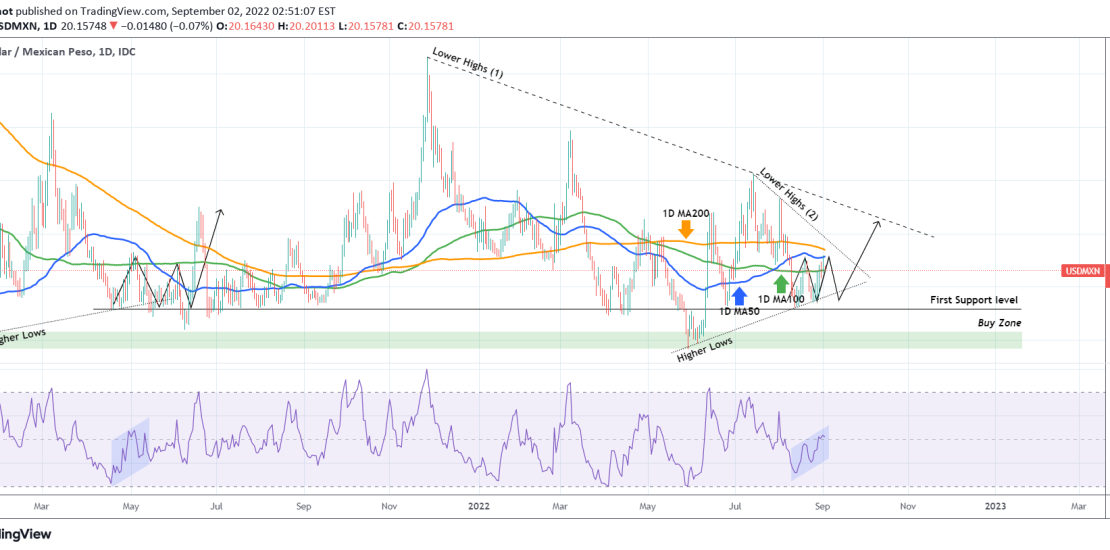
The USDMXN pair has been one of the better range pairs to trade in the market throughout the past 2 years. At the moment it is consolidating within the 1D MA50 (blue trend-line) and the Higher Lows trend-line. The 1D MA200 (orange trend-line) is the last line of Resistance, on the Lower Highs (2)
-
EURUSD Short-term rebound to 1D MA50 possible ahead of the NFP
- August 30, 2022
- Posted by: Tradingshot Articles
- Category: Forex
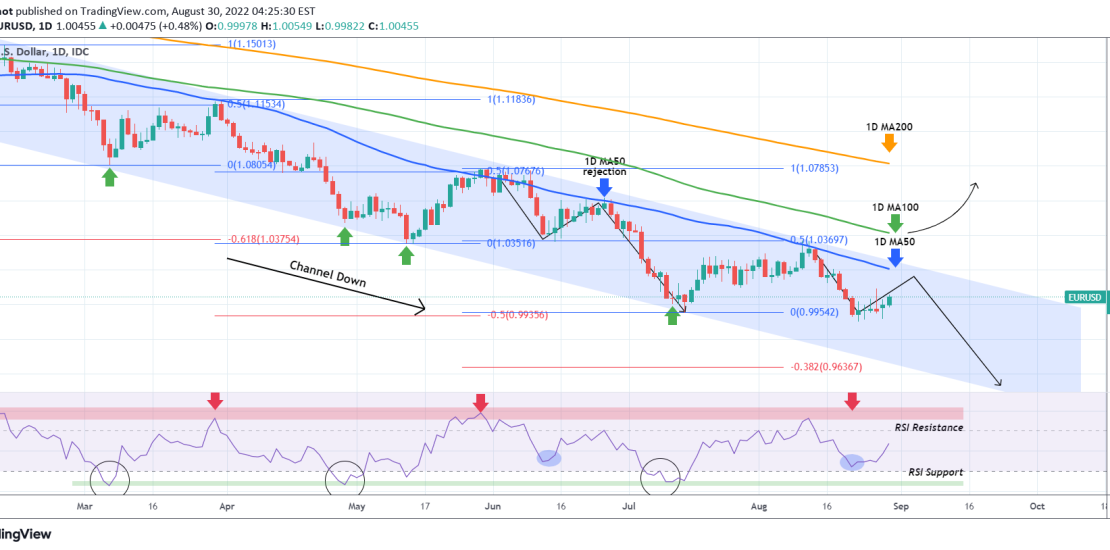
The EURUSD pair has entered the U.S. Nonfarm Payrolls (NFP) week scheduled for this Friday with some stabilization bias. It appears that the price is respecting the August 23 Low as the new short-term Support, which along with the July 14 Low being that close, make a solid Zone. With the 1D RSI rebounding
-
USDJPY is close to making a long-term top
- August 29, 2022
- Posted by: Tradingshot Articles
- Category: Forex
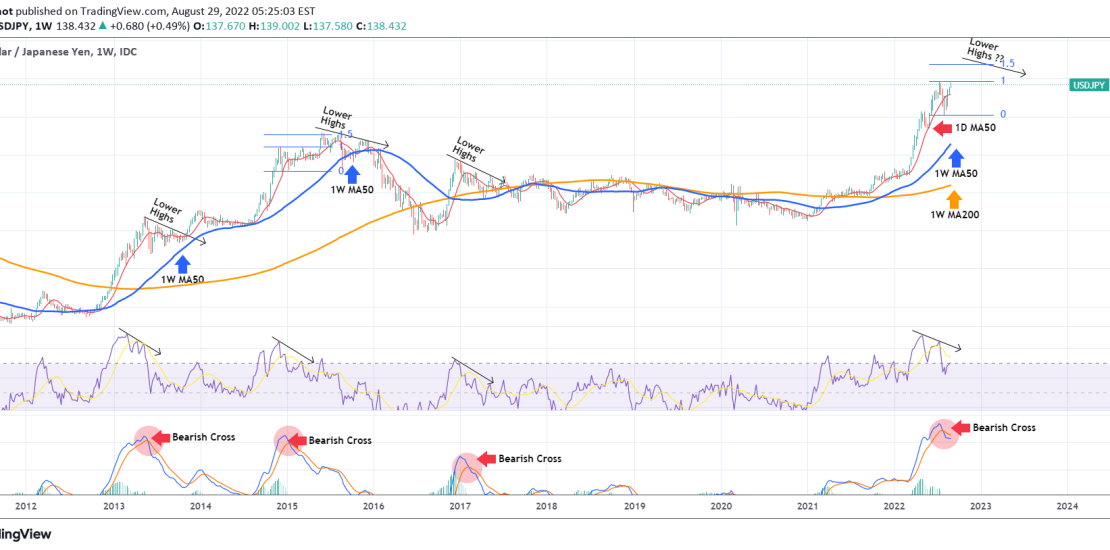
The USDJPY pair has been on a very aggressive (turned into parabolic) rise since the 2021 Low. It has been above the 1W MA50 (blue trend-line) and the 1W MA200 (orange trend-line) for the whole year. In the past 30 days it broke below the 1D MA50 (red trend-line) but recovered all the losses
