

- September 19, 2022
- Posted by: Tradingshot Articles
- Category: Forex
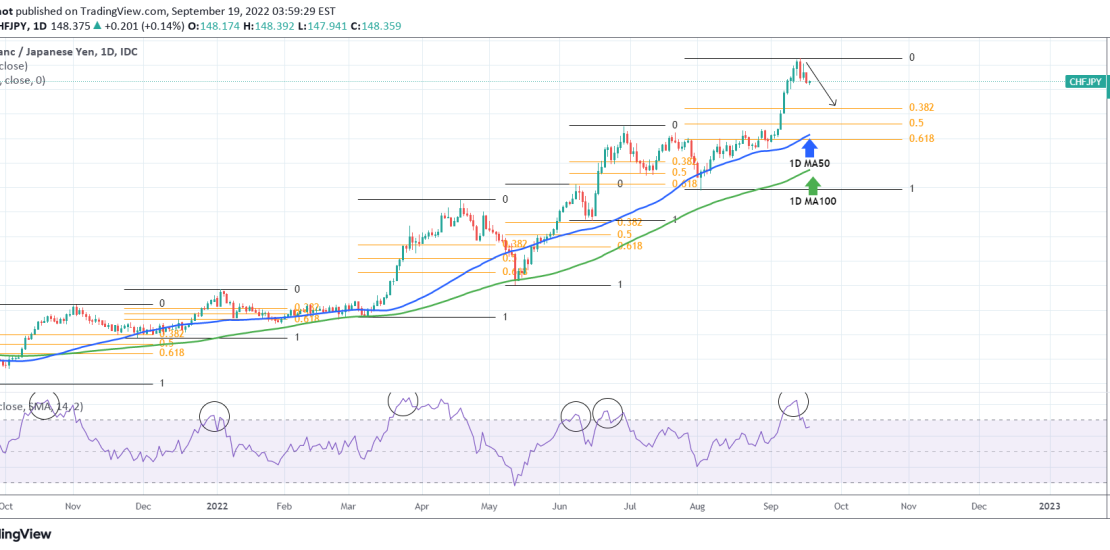
The CHFJPY pair has been pulling back after the September 13 High, following the impressive rally since the August 02 low. This pull-back is taking place after the 1D RSI broke the 80.00 heavily overbought barrier.
On this 1D chart, you may notice that especially since October 20, 2021, every time the 1D RSI got heavily reversed upon breaking the 70.00 level, the pair pulled-back. Out of the 5 times that happened in total, in 2 occasions it hit the 0.382 Fibonacci retracement level, and in the other 3 in broke even below the 0.618 Fib.
As a result, it is highly likely to see this pattern repeating. The 0.382 Fib is the highly probable target and is at 145.600 (where is should hit the 1D MA50 (blue trend-line) in the process), while the 0.618 is at 142.500 (where it could make contact with the 1D MA100 (green trend-line)). If you are a medium-term, swing trader, this is one of the most consistent trades you can take at the moment.
Tradingview link: