

- September 15, 2022
- Posted by: Tradingshot Articles
- Category: Forex
The U.S. Dollar Index (DXY) has been rising all year in the aftermath of the Fed to decide to raise the interest rates in their battle to lower the extreme levels of inflation. As a result, the USD has been gaining against the basket of major world currencies. From a technical perspective though, the time is approaching that it may reverse massively downwards as it is meeting two key long-term rejection levels.
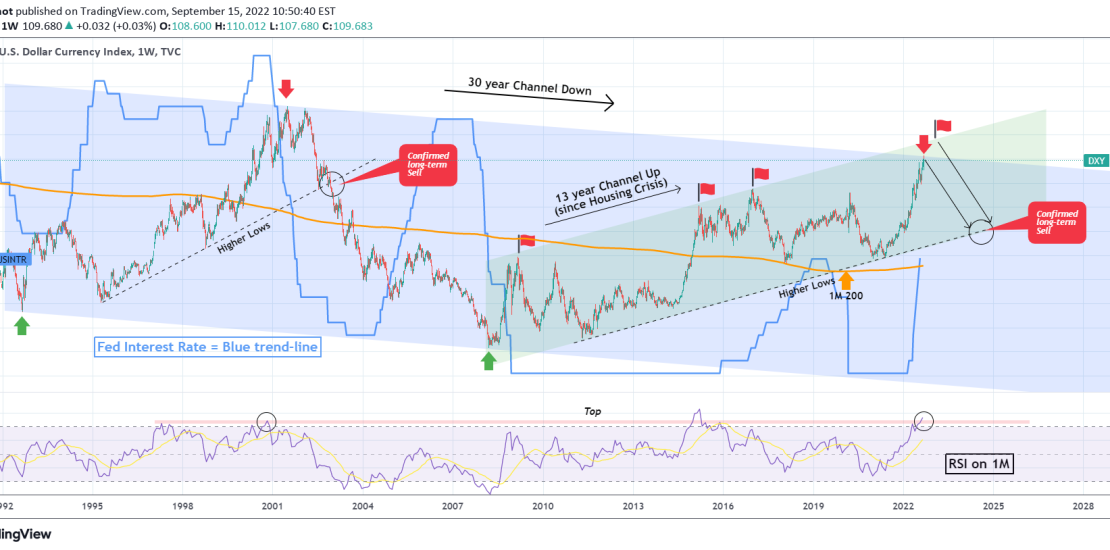
The first and most important is the top (Lower Highs trend-line) of the 30 year Channel Down pattern, which started after the August 1992 Low! As you see this Channel has so far two Lower Lows (green arrows) and two Lower Highs (red arrows). The most recent of the latter was printed on last week’s 1W candle. The price hit the top of the Channel Down and got instantly rejected. However, with this week’s worse than expected CPI, we see the current 1W candle in green, attempting to hit the top again. Until we close a weekly candle above it, we have to consider this level as a possible long-term trend reversal/ rejection for the DXY.
If the USD Index does break and close above it, then we will come across very quickly another key long-term rejection level, and that is the Higher Highs trend-line of the 13 year Channel Up pattern that started in the aftermath of the Housing Crisis in 2009. As you see, so far the Higher Highs trend-line has made three contacts with that line (red Flags). The next (if the Channel Down breaks) should be around 114.00. That is the second long-term candidate level for rejection.
This historic price action shows that potentially, going short at the current levels on the U.S. Dollar, offers a low Risk high Return set-up, at least on the long-term. Of course, the macroeconomic environment has to keep up in order for the technicals to play out, especially being in this highly inflationary environment. A key factor is the Fed’s Interest Rate (blue trend-line). As mentioned above, this has been rising since the start of the year, causing this parabolic rally on DXY. We see that in the course of the past 30 years, every time the Interest Rate dropped, the DXY was following downwards.
As a result, if the Fed decides by the start of next year that the job has been done and that inflation may be (partially at least) controlled, the can start cutting the Interest Rate back in order to stimulate the stock market, which has been suffering all year long. A mere hint/ announcement by the Fed of such intention early, can cause the DXY to reverse before the Interest Rate even starts decreasing, as it happened after 2006. The times we live in are unique in terms of the fundamentals and more likely than not the battle to control an inflation caused by years of abuse can take an equal amount to years.
At last, if you are a long-term investor looking for a confirmed level to sell, that would be below the Higher Lows trend-line, as it happened in December 2002.
Tradingview link: