
-
MATICBTC Why surprised? This should have been expected.
- December 11, 2019
- Posted by: Tradingshot Articles
- Category: Cryptocurrency
No Comments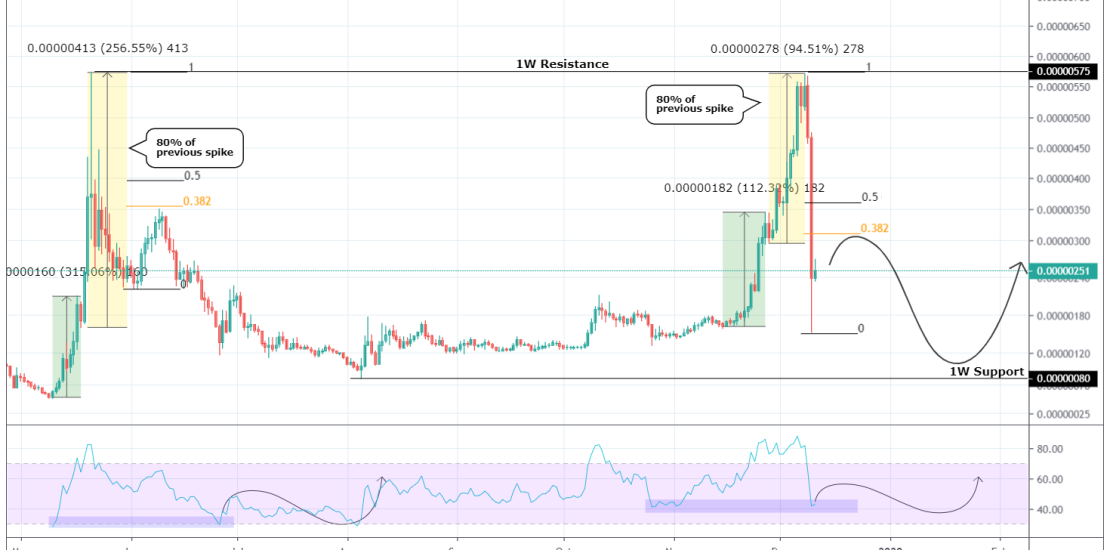
MATIC left a whole lot of people wondering why it was massively sold two days ago. Well the answer is simple, it was rejected on the 1W Resistance. It was a move perfectly calculated on the trade idea seen below: The rise prior to the rejection was easily seen on an early stage: So what
-
ETHEREUM is a 2nd chance for those who missed out on BITCOIN
- December 10, 2019
- Posted by: Tradingshot Articles
- Category: Cryptocurrency
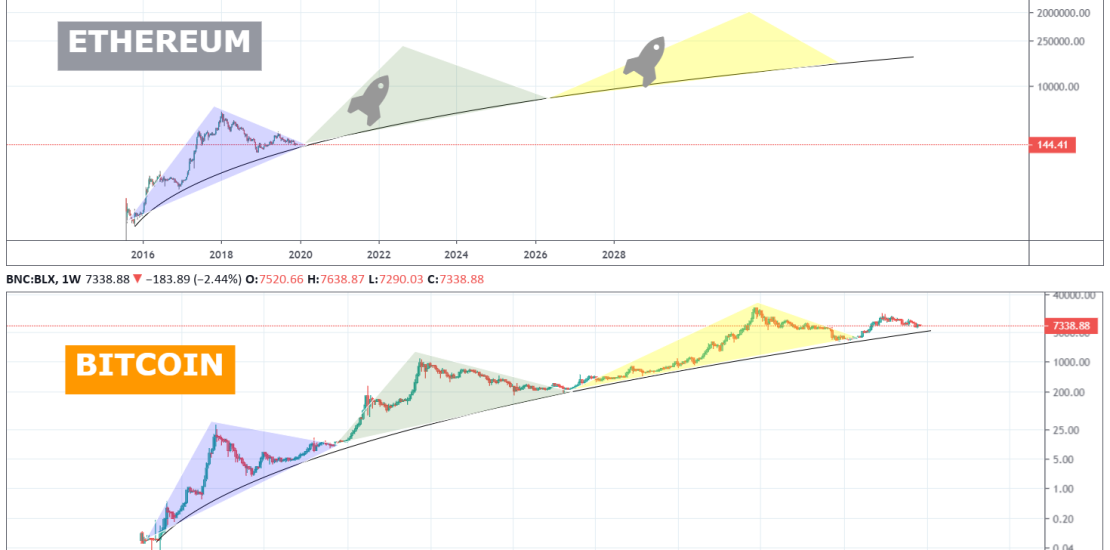
I have been into ETHUSD for a very long time and was always interested at the fundamental similarities with BTCUSD. I always thought that Ethereum was repeating Bitcoin’s first Cycle and even published this study: I am not going to go into much detail on this analysis. The candle action resemblance of ETH with BTC’s
-
BITCOIN Will 2020 be the year of recovery and accumulation?
- November 30, 2019
- Posted by: Tradingshot Articles
- Category: Cryptocurrency
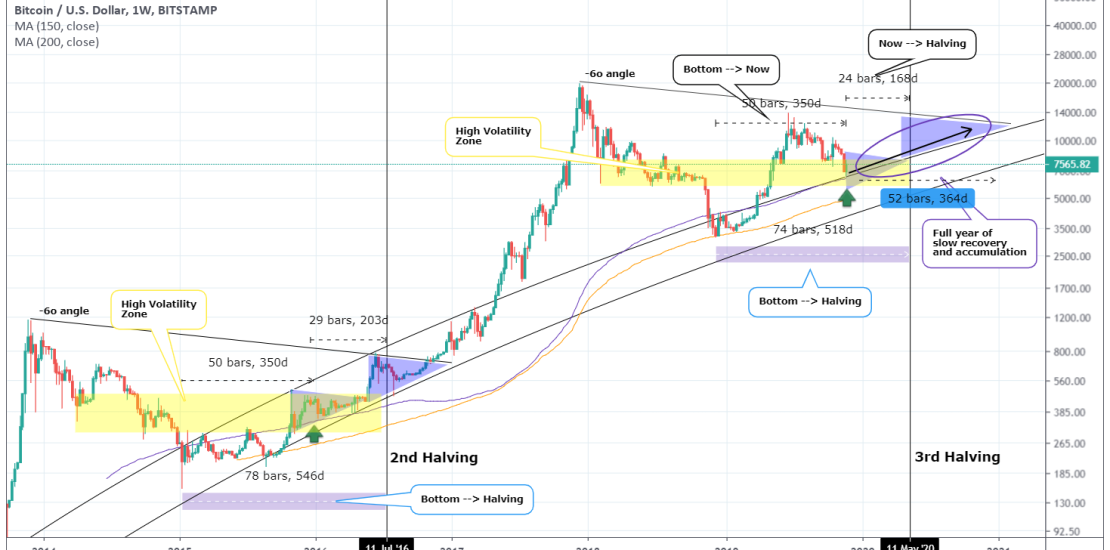
I have been asked by certain enthusiastic followers (I thank everyone for the support), to make an update on the following chart: *$6000 bottom while everyone was bullish to 20K* As you see it was late September with Bitcoin trading at $10000 and everyone pretty bullish when this idea was published talking about a potential
-
MATICBTC All targets hit. One last spike left?
- November 30, 2019
- Posted by: Tradingshot Articles
- Category: Cryptocurrency
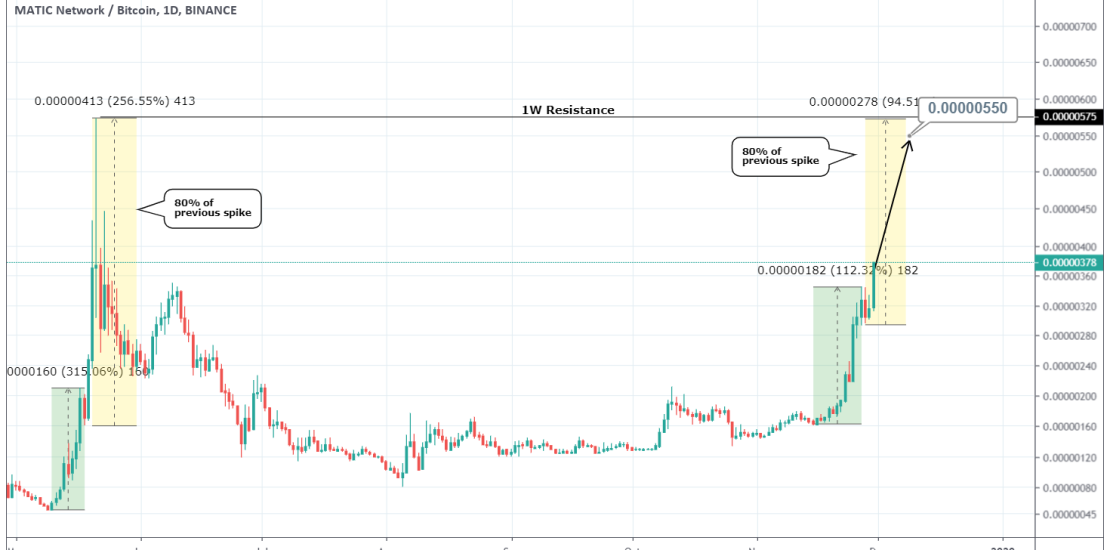
This is a follow up of the last MATICBTC call where both Targets got hit (0.00000268 and 0.00000350) as you can see below: Now I have found an interesting correlation for those of you who want to take some more risk. The similarities with the May parabolic rise are strong. That sequence is divided
-
$6500 on BITCOIN there you have it! Final flush and up we go!
- November 25, 2019
- Posted by: Tradingshot Articles
- Category: Cryptocurrency
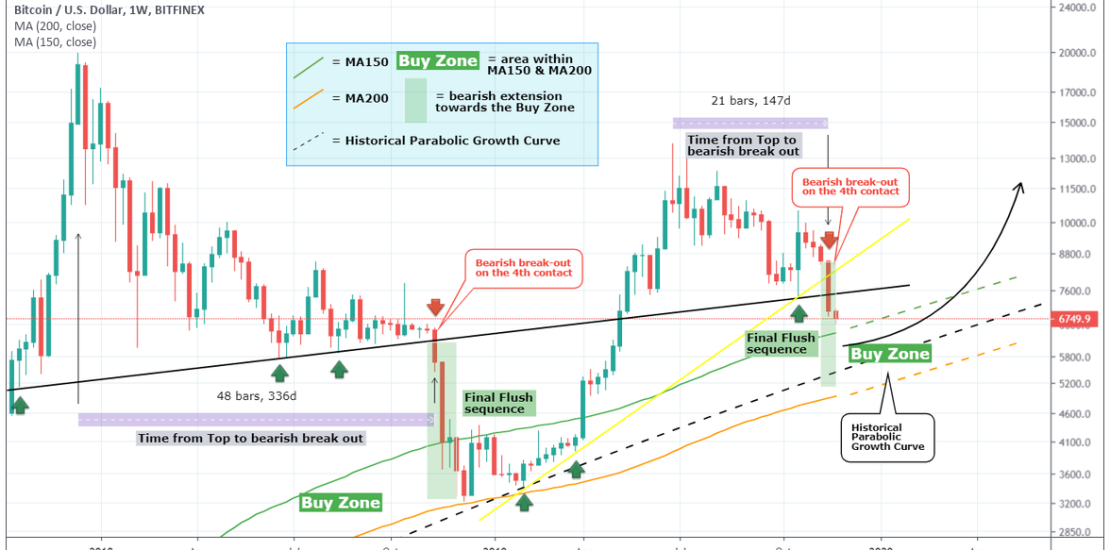
Well eventually all projections for a $6500 price on Bitcoin have proved to be correct. The following study in particular came incredibly close to estimating 6500 on December 1: *The 4th contact sell-off* What I want to focus on today is an analysis I posted 5 days ago (see the chart right below) when
-
LINKBTC Parabolic to 0.00055.
- November 13, 2019
- Posted by: Tradingshot Articles
- Category: Cryptocurrency
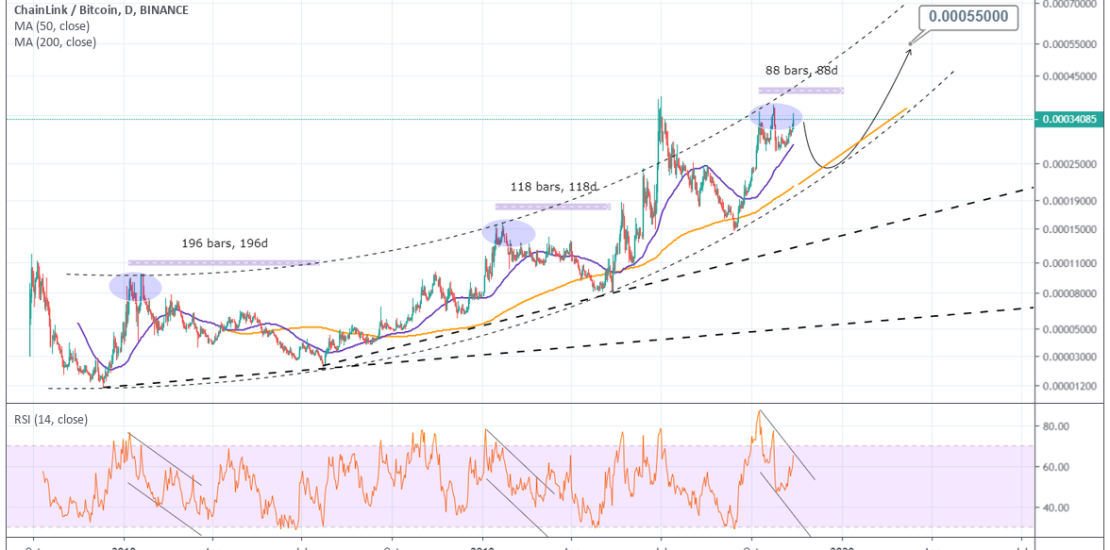
Buyers can be very pleased just by looking this chart of Chainlink. One of the most profitable coins lately being parabolic to Bitcoin. As seen on the chart, when the RSI posts this bearish divergence with the price candles hitting Double Tops, the pair makes a top, pulls back and consolidates until the next
-
Is this a sign that the ALT SEASON has started?
- November 12, 2019
- Posted by: Tradingshot Articles
- Category: Cryptocurrency
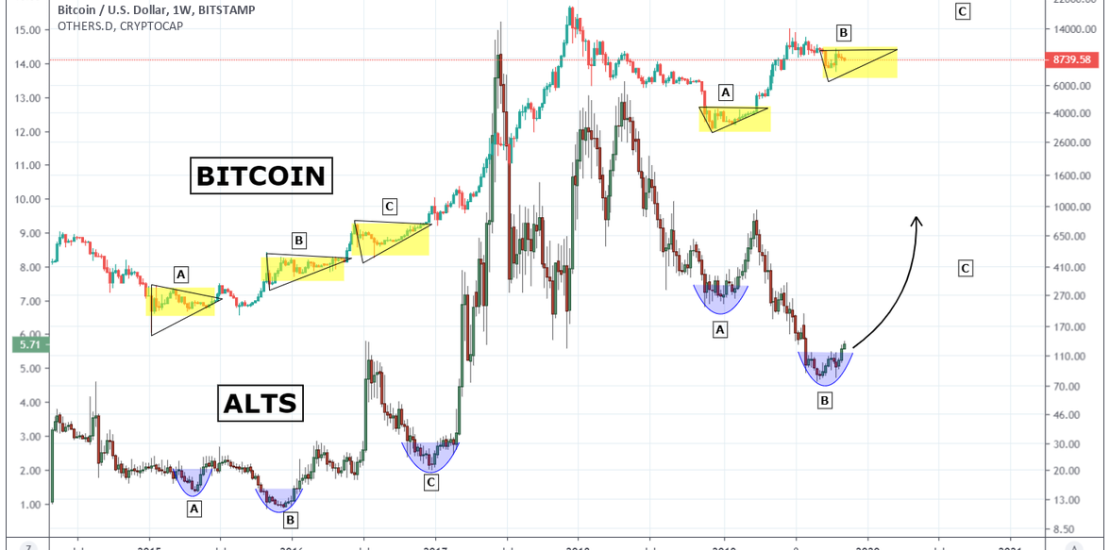
I will keep things very simple this time in my attempt to determine if we have started a new Bulls Cycle on the Alt Coins. On this chart I compare Bitcoin to Alts Dominance. It seems quite obvious to me that when a certain patterns form both on BTC and ALTS at the same
-
EOSBTC Buy Signal
- November 10, 2019
- Posted by: Tradingshot Articles
- Category: Cryptocurrency
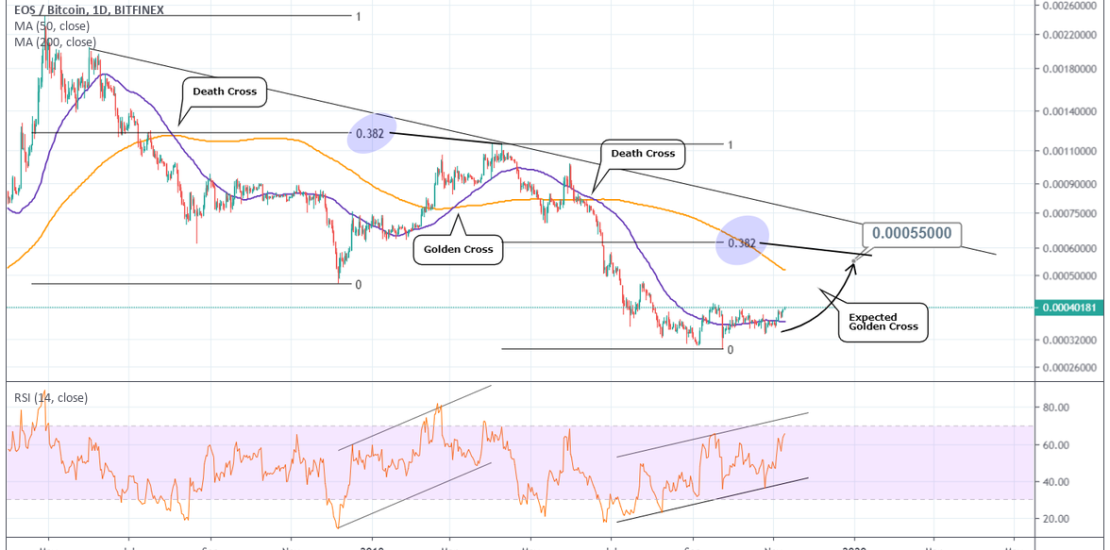
Pattern: 1M Channel Down. Signal: Bullish as the price based on the RSI appears to be replicating a previous seuquence that led to a new Lower High. Target: 0.00055 (right below the 0.382 Fibonacci retracement). Tradingview link: https://www.tradingview.com/chart/EOSBTC/Owl6j3Zh-EOSBTC-Buy-Signal
-
BITCOIN Sell Alert based on this MACD cross signal.
- November 7, 2019
- Posted by: Tradingshot Articles
- Category: Cryptocurrency
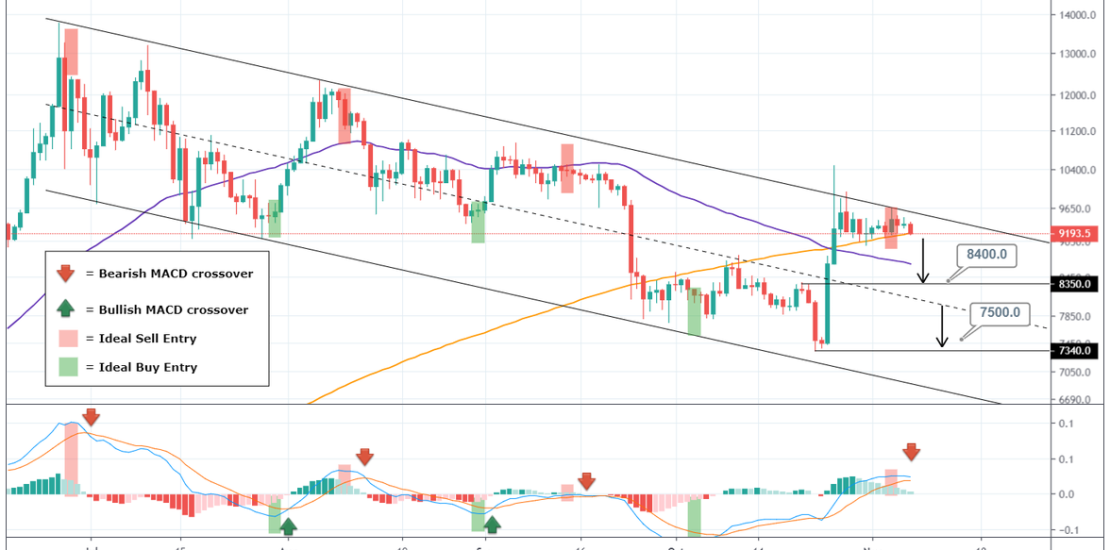
On today’s BTCUSD analysis I stay on the medium term, looking at the 1D chart and what trading signals this pattern can provide. Since the June 26th market top, Bitcoin as entered into a very structured Channel Down (basically extending into the 1W time frame). This pattern has never broken actively (only marginal break outs
-
The pattern that has to hold in order to keep BITCOIN bullish.
- November 4, 2019
- Posted by: Tradingshot Articles
- Category: Cryptocurrency
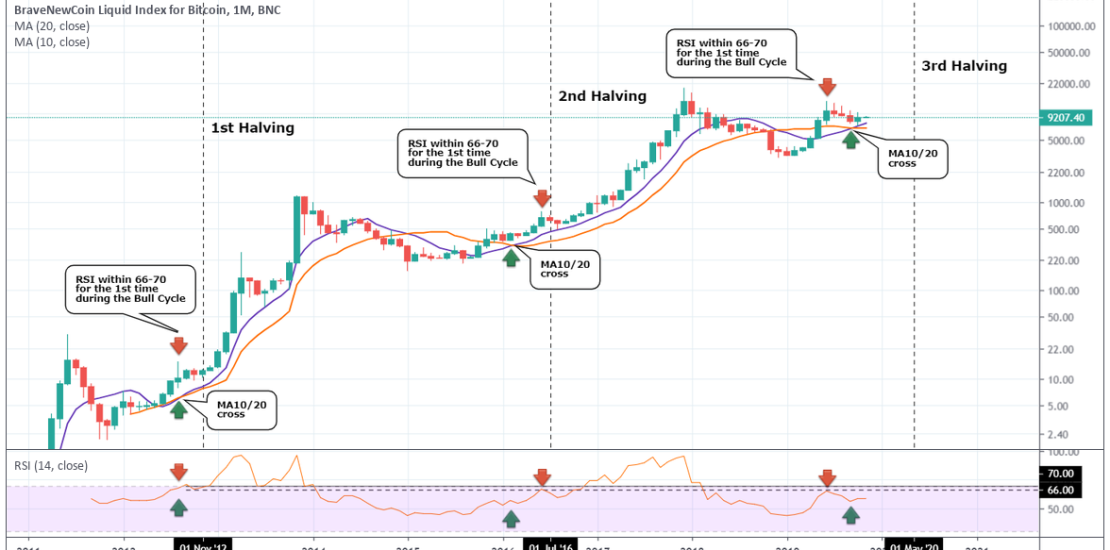
This is just a simple long term observation on Bitcoin’s 1M chart using two indicators that have previously never failed to keep the long term trend bullish and basically start the final (and more aggressive) stage of the Bull Cycle. MA10/20 cross and RSI This combination involves the MA10/20 cross and the RSI within the
