
-
BITCOIN What will be the Rate of Return on this bull cycle?
- June 25, 2019
- Posted by: Tradingshot Articles
- Category: Cryptocurrency
No Comments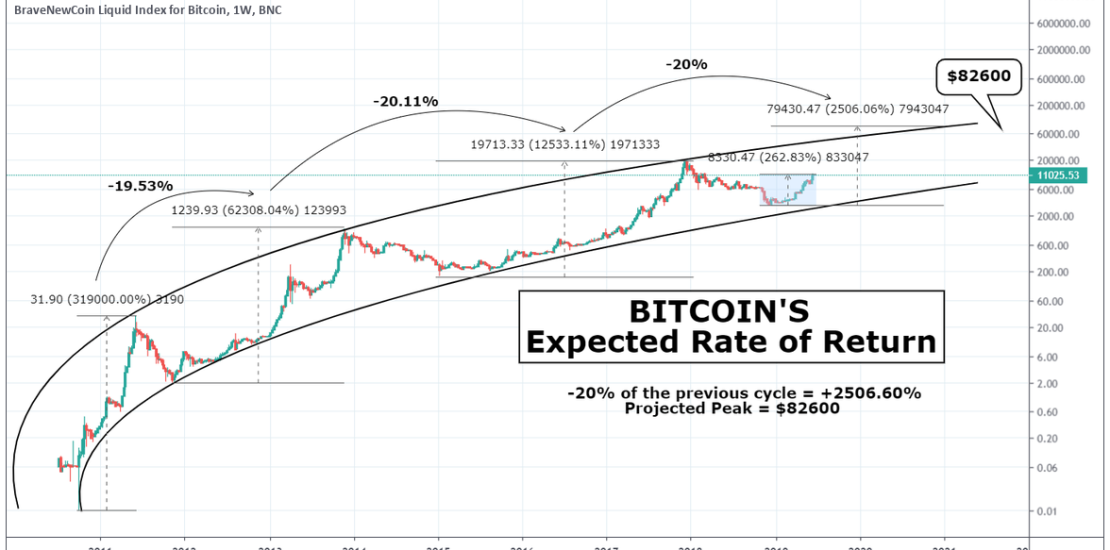
Traders and investors are looking for the highest possible rate of return when trading Bitcoin, especially after a better than expected start in 2019 to the new bull market. I tried to estimate the expected Rate of Return on the current bull cycle based on BTC’s historical logarithmic curve. It is easy to realize at
-
BITCOIN 10k broken! This buy wave isn’t over according to Gold!!
- June 22, 2019
- Posted by: Tradingshot Articles
- Category: Cryptocurrency
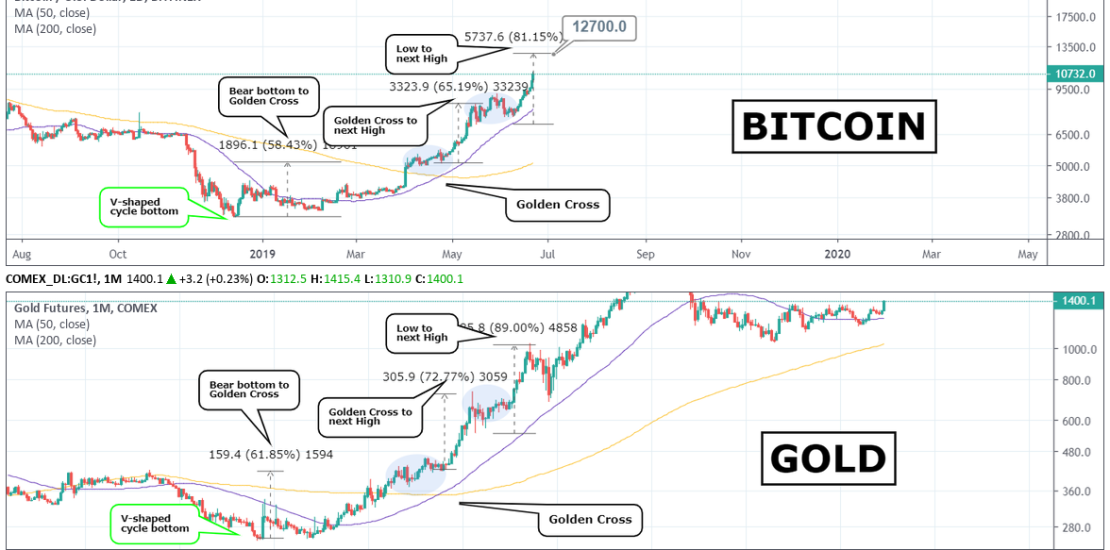
The Bitcoin – Gold road-map (the Golden standard as many call it) holds firm! Their parallel course continues but traders continue to turn their back on it. Why ignore the BTC-Gold comparison when it has been 100% accurate so far? First it predicted the market bottom and the subsequent early buy signal based on it
-
BITCOIN mapping $10500
- May 30, 2019
- Posted by: Tradingshot Articles
- Category: Cryptocurrency
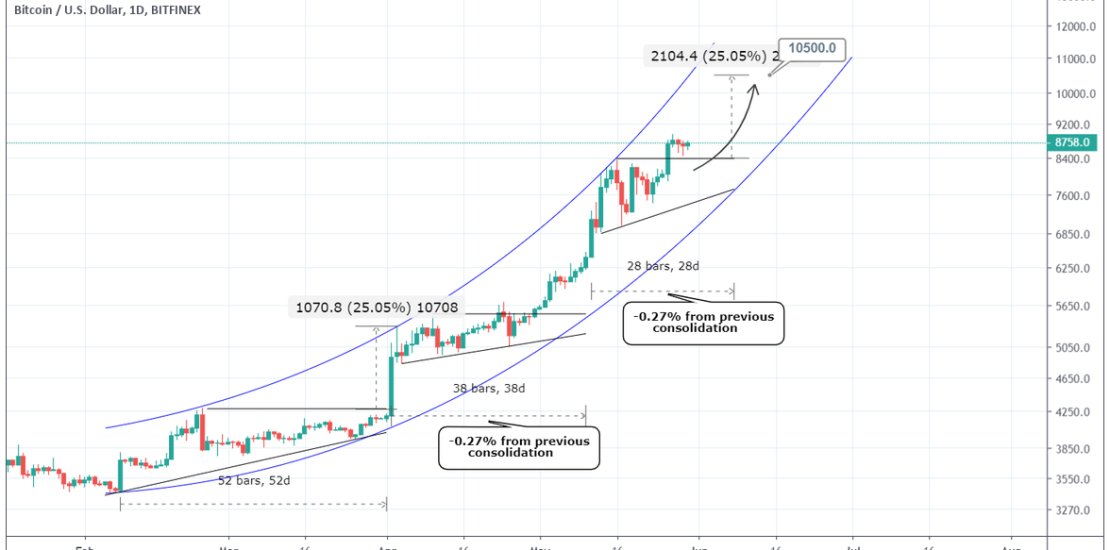
I have attempted to break down the current 4 month parabola into a strong sequence of patterns and what stands out is the Ascending Triangle. Before each aggressive bullish candle sequence within the Parabola, BTC consolidated roughly within an Ascending Triangle formation. When that Triangle broke upwards, an aggressive new Top was made. Assuming that
-
Can this pattern delay Bitcoin’s growth?
- May 25, 2019
- Posted by: Tradingshot Articles
- Category: Cryptocurrency
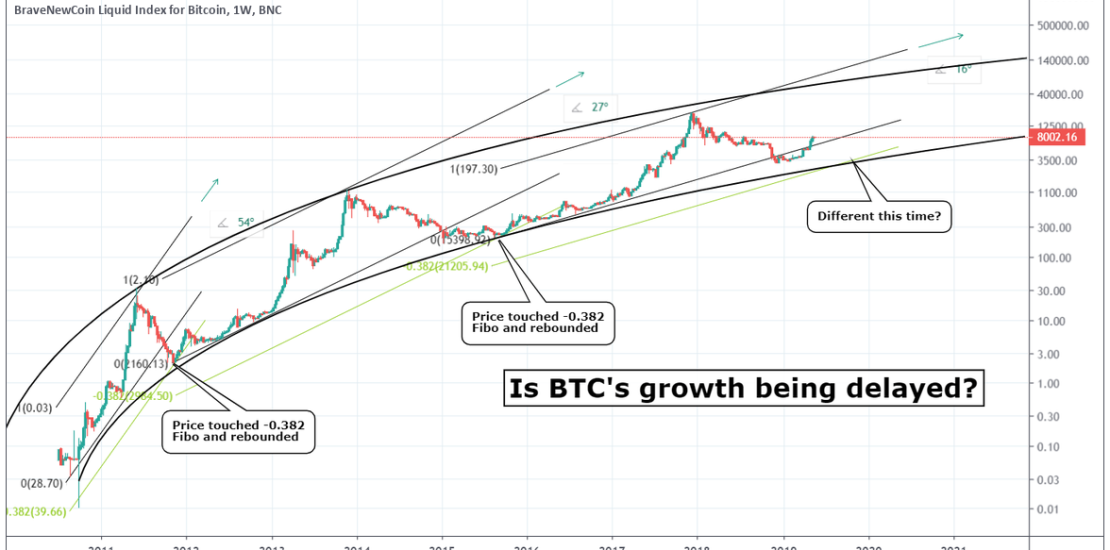
This is a quick reflection on Bitcoin’s Fibonacci Channel’s within its long term parabolic growth curve. In the two previous cycles, the price touched the -0.382 Fibonacci retracement level before it rebounded. This marked the end of that market’s bear cycle and that bottom gave way to the new bull cycle. This time it hasn’t
-
BITCOIN CASH eyes 400 before a pull back?
- April 7, 2019
- Posted by: Tradingshot Articles
- Category: Cryptocurrency
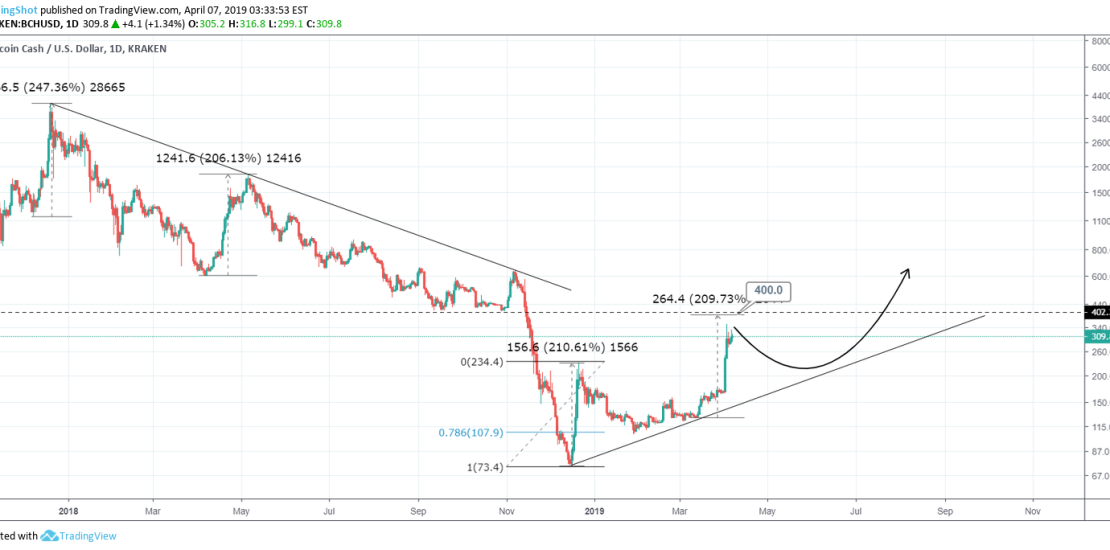
Not too complicated TA combinations on this one. Purely based on the fact that every +200% rise on BCH after the All Time Highs, ended with a decline. Obviously during the bear market the price broke the low, while since the December bottom, the sole +200% rise pulled back to its 0.786 Fibonacci. If the
-
BITCOIN The parabolic bull run’s support
- March 20, 2019
- Posted by: Tradingshot Articles
- Category: Cryptocurrency
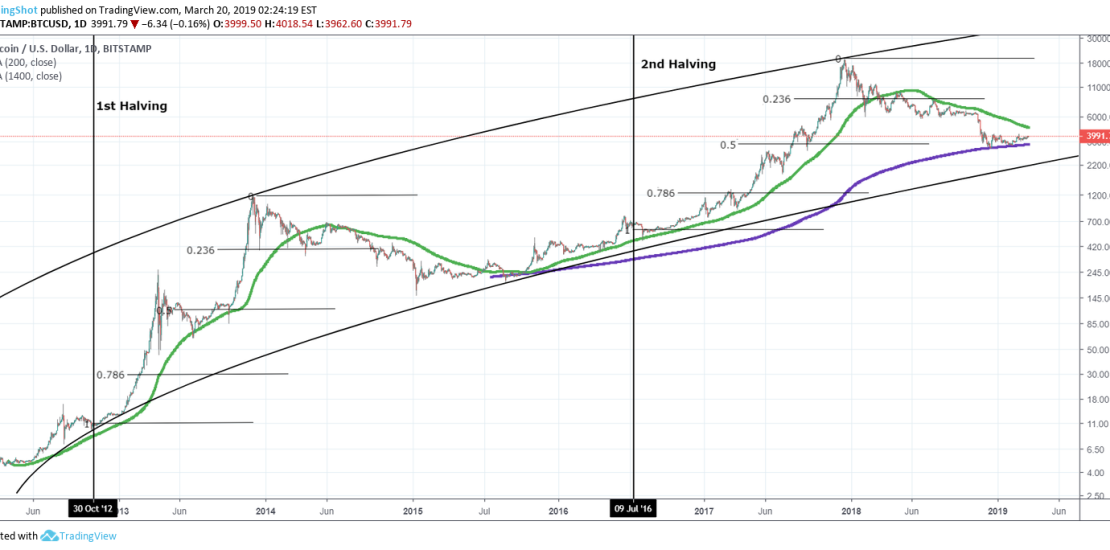
As BTC gets closer to the essential MA200 test supported by the MA1400 on 1D, I have come across a new support level level, which has been missing from key analyses out there. It is known that the Halvings historically signal the start of the new bull market on Bitcoin that escalates into a parabolic
-
Is the Altcoin market about to explode?
- March 16, 2019
- Posted by: Tradingshot Articles
- Category: Cryptocurrency
Those who are into fractals will love this. The RSI on the 1W Altcoin Market Cap (ex BTC) is posting a similar sequence to the November 2014 – March 2015 price action. The small dip that followed gave way to the start of the bull market on Alts. Is this an early buy signal on
-
Bitcoin’s Fibonacci Channel and the Band Shift to 100k
- March 11, 2019
- Posted by: Tradingshot Articles
- Category: Cryptocurrency
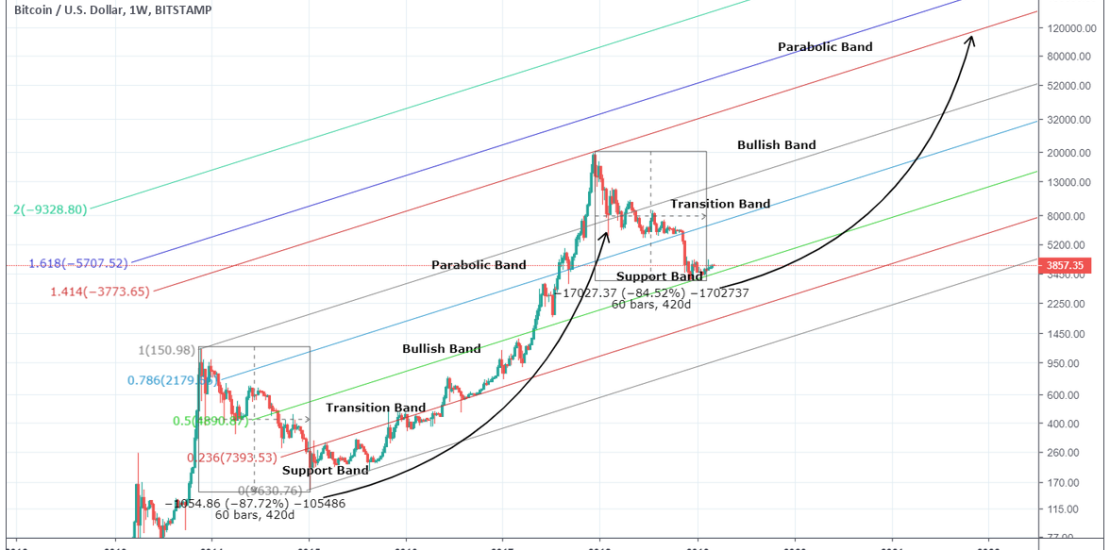
BTC’s last bull market can be adequately broken down using the Fibonacci Channel as a Phase Marker. During 2015 the 0 – 0.236 Fibonacci band was used as a Support. Similarly in 2016 the 0.236 – 0.5 was the Transition Phase from the Bottom to the start of the new Bull Market, leading to then
-
BITCOIN The bottom is in. Would you miss this chance in 2015?
- March 5, 2019
- Posted by: Tradingshot Articles
- Category: Cryptocurrency
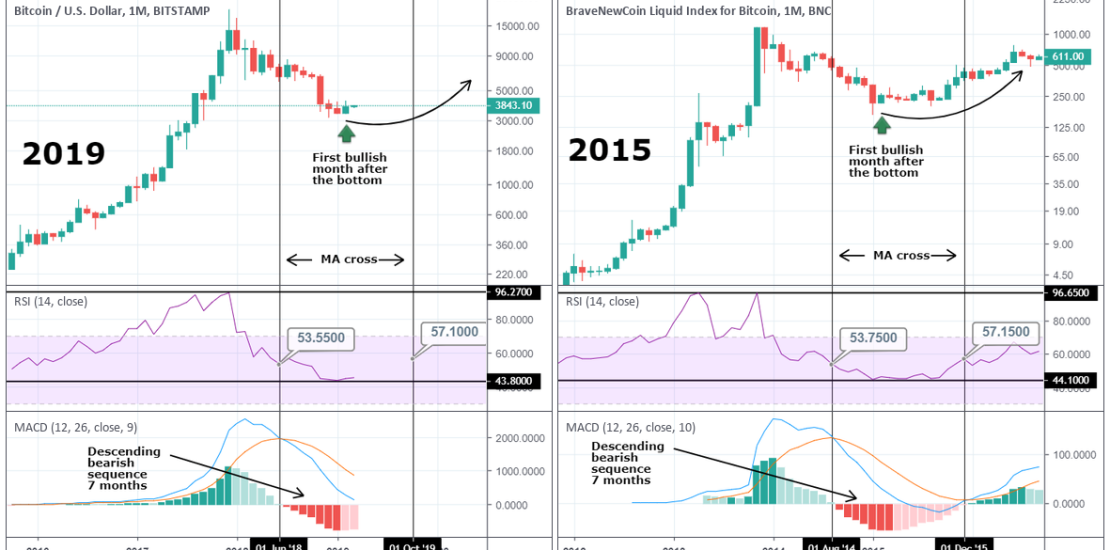
Similarities of now (2019) and then (2015) showing that the bottom is already in and after some months of consolidation we will start seeing higher and higher prices. * RSI 2019: the RSI peaked at 96.2700 on the ATH then dropped to 43.800, near the level it is currently consolidating. The bearish MA cross took place with
-
Cardano targets 0.08300.
- February 24, 2019
- Posted by: Tradingshot Articles
- Category: Cryptocurrency
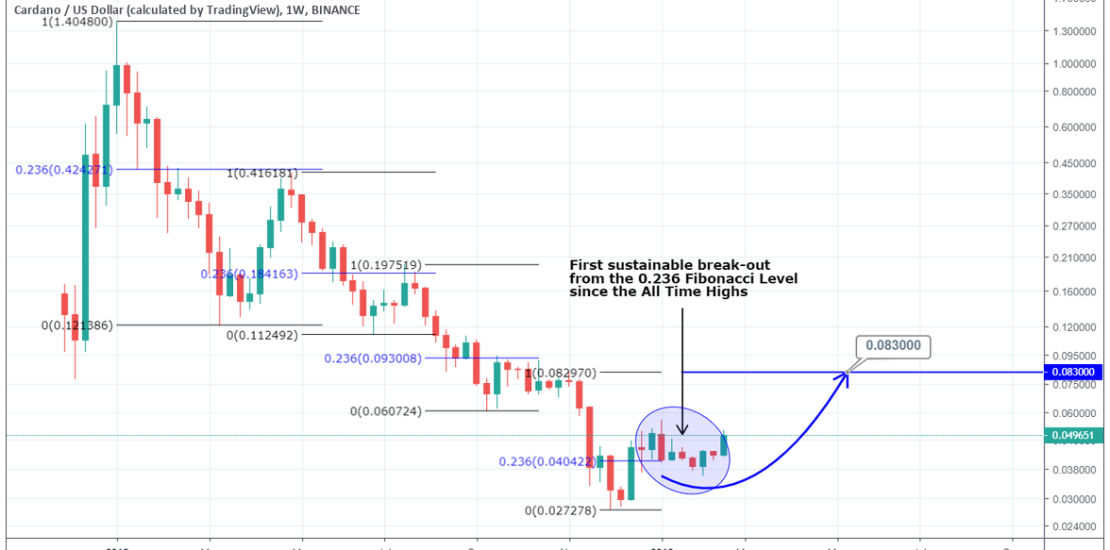
Simple Fibonacci levels provide the bullish signal here. Since the All time Highs, ADAUSD was being rejected on the 0.236 Fibonacci retracement. Last time this level broke the uptrend has been sustained and no Lower Low has been made yet. This is a long term bullish signal. Target: 0.08300 which is the 100% gap fill
