- November 4, 2019
- Posted by: Tradingshot Articles
- Category: Cryptocurrency

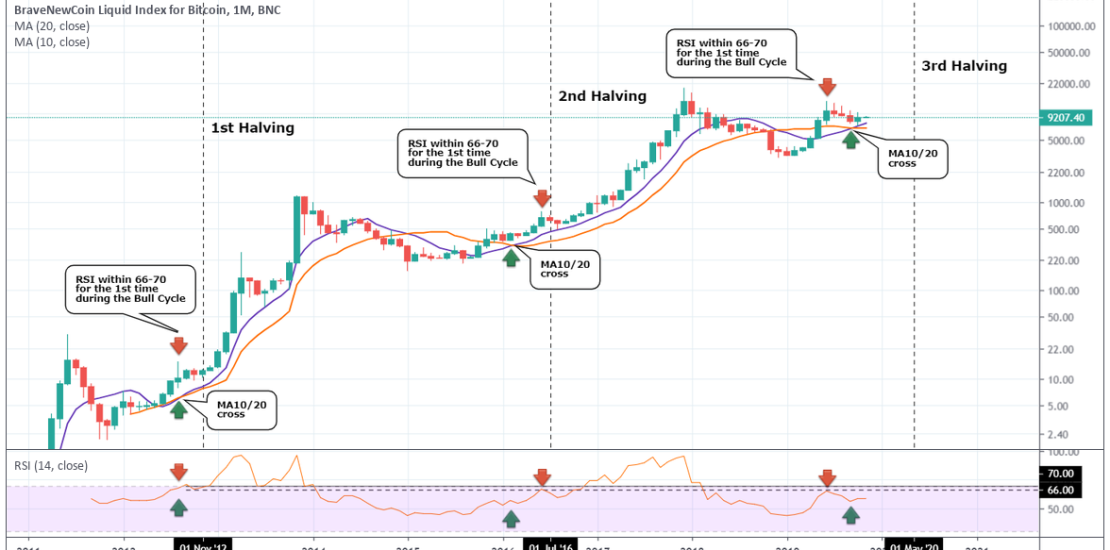
This is just a simple long term observation on Bitcoin’s 1M chart using two indicators that have previously never failed to keep the long term trend bullish and basically start the final (and more aggressive) stage of the Bull Cycle.
MA10/20 cross and RSI
This combination involves the MA10/20 cross and the RSI within the 66-70 zone. During the previous 2 Bull Cycles (2012/2013 and 2016/2017) when the MA10 crossed over the MA20 on the 1M chart, BTCUSD never trade below either MA periods until the Cycle’s Top and the start of the next Bear Market. Furthermore, an RSI reading within 66.000 – 70.000 before the Halving, always delivered the last pull back/ consolidation before the most aggressive rise of the Bull Cycle.
On the 2012/2013 Bull Cycle both readings took place around the same time, while during 2016/2017 the MA10/20 Cross preceded the RSI top. On the current Cycle we see for the first time the RSI reaching 66.000 before the MA cross. However both of them took place before the next (May 2020 Halving) and in fact much earlier than the previous two cycles.
What can this mean for Bitcoin investors? Everything. So far the current pull back has been contained above the MA10 and MA20 keeping this long term bullish sequence intact. However the slightest break below will create an uncharted territory and may endanger the paradigm of the Bull Cycle. At the moment and if this is intact until the Halving, Bitcoin holders can feel secure.
Would you consider those indicators reliable in designating the low of the current phase? Let me know in the comments section.
Please like, subscribe and share your ideas and charts with the community!
Tradingview link:

