

- November 12, 2019
- Posted by: Tradingshot Articles
- Category: Cryptocurrency
I will keep things very simple this time in my attempt to determine if we have started a new Bulls Cycle on the Alt Coins.
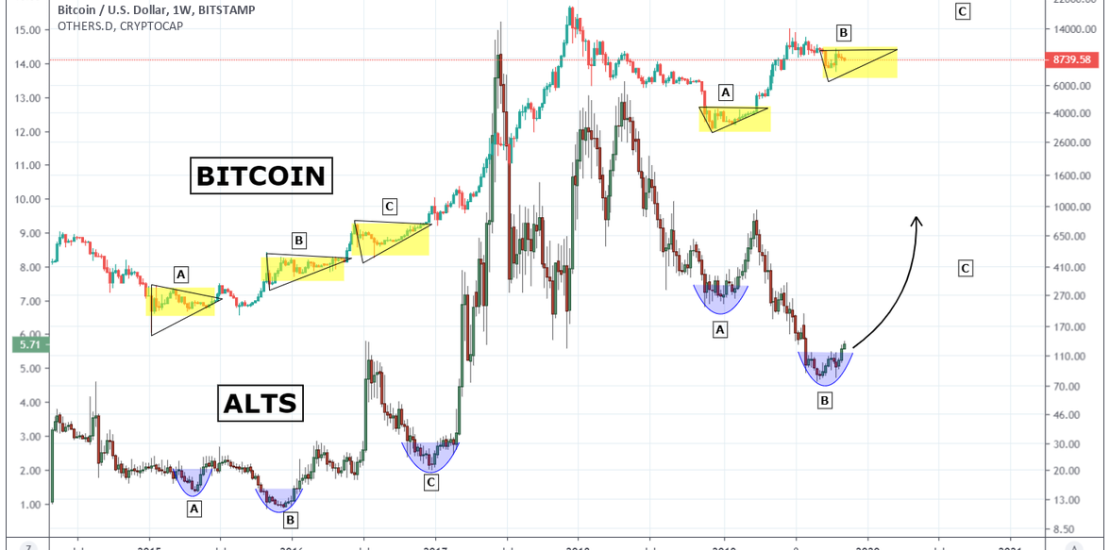
On this chart I compare Bitcoin to Alts Dominance.
It seems quite obvious to me that when a certain patterns form both on BTC and ALTS at the same time, a new Alt Season starts. What are those? For Bitcoin you may treat the formation as a Triangle. For the Alts a Cup or Inverse H&S, whatever suits your eye better. The point is that when those take place at the same time, the Alt market booms (exception maybe the April 2015 minor rise).
As for the current candle action more particularly, we see that the alt dominance has already broken above its 3 month Resistance and is outside the Cup. If the 2015 – 2016 pattern replicates itself then I am expecting Alt Dominance to reach the late March/ early April 2019 levels at least before a new pull back.
Would you consider those patterns as viable indicators of an Alt Season? Let me know in the comments section!
Please like, subscribe and share your ideas and charts with the community!
Tradingview link:
https://www.tradingview.com/chart/BTCUSD/iyy9sJ23-Is-this-a-sign-that-the-ALT-SEASON-has-started