

- November 25, 2019
- Posted by: Tradingshot Articles
- Category: Cryptocurrency
Well eventually all projections for a $6500 price on Bitcoin have proved to be correct. The following study in particular came incredibly close to estimating 6500 on December 1:

*The 4th contact sell-off*
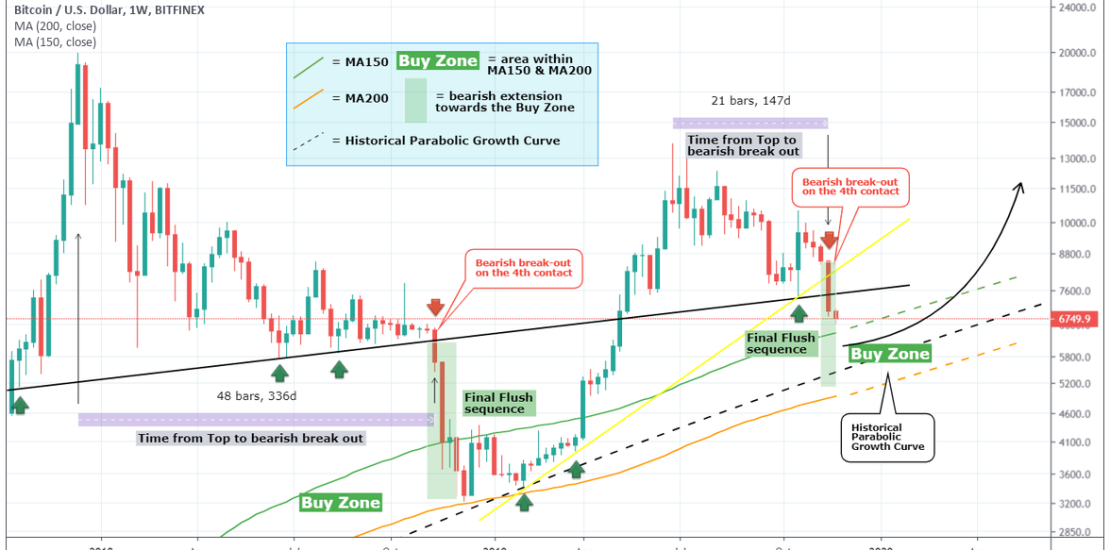
What I want to focus on today is an analysis I posted 5 days ago (see the chart right below) when the price was at 8200 showing that a break below the yellow line on the 4th contact would initiate an aggressive sell-off, similar to what happened in November 2018. Well the break-out did happen, $6500 showed up and BTC is just above the Buy Zone indicated by the MA150 and MA200 on the 1D chart.

*Where does this sell-off end?*
So where does this sell-off end? If the study (listed at the beginning of this analysis) about the symmetrical format between the two patterns is correct, then I project the following. The time from the June 2019 peak until the break-out of the yellow line is roughly half the time between the December 2017 All Time High and the break-out of the black line (Nov 2018). We can assume that the final flush leading to the bottom will be also half this time and after that a lengthy consolidation will follow. This suggests that the bottom will be either this week or the next!
Are you ready to buy for $20000 and beyond? Let me know in the comments section!
Please like, subscribe and share your ideas and charts with the community!
Tradingview link: