

- November 30, 2019
- Posted by: Tradingshot Articles
- Category: Cryptocurrency
I have been asked by certain enthusiastic followers (I thank everyone for the support), to make an update on the following chart:

*$6000 bottom while everyone was bullish to 20K*
As you see it was late September with Bitcoin trading at $10000 and everyone pretty bullish when this idea was published talking about a potential ~ $6000 bottom. Radical or not we’ve reached the 6000 region last week but as that chart shows we are far from getting the current (2nd) Accumulation phase of this Bull Cycle over.
*The May 2020 Halving*
The reason is simple and has a name: Bitcoin’s 2020 (3rd) Halving. That correction is directly related to the upcoming 3rd Halving and the implications where thoroughly discussed on the following study:

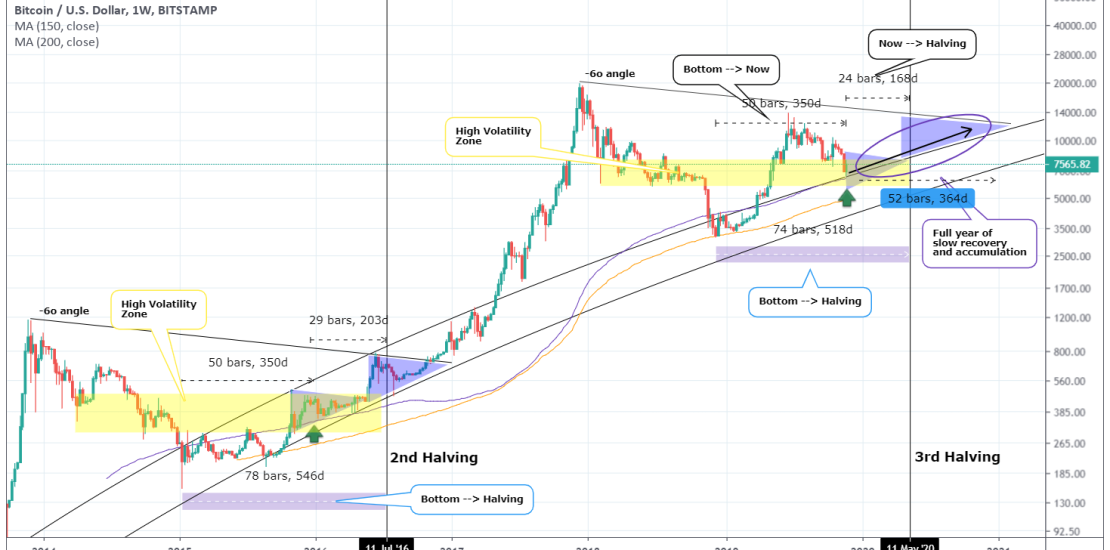
BTC tends to stay low on the 1W MA150 before the Halving, consolidate and rise a few weeks towards the Halving.
*So where are we now? The importance of the High Volatility Zone*
I expect a similar pattern to play out this time also as the current Accumulation Phase is far from over. They key element that makes a small difference this time is the High Volatility zone which was extensively analyzed on the following study:

As you see in 2014 – 2016 that zone kept Bitcoin ranged within a Triangle up until roughly 2 weeks before the halving (price almost doubled). This time the Volatility zone is again there calling for consolidation before the Halving. The difference is that due to the stronger early rise from April to June, the price had to correct more aggressively leaving many traders think that this is something more than “expected”. But it is perfectly normal and within Bitcoin’s long term models.
*Similarities*
The similarities are strong. Just last week the price touched the 1W MA150. This puts the contact at 350 days from the market bottom. Surprisingly during the 2016 cycle, the price also made contact with the 1W MA150 350 days from the bottom. Also the time from the bear cycle bottom to the Halving was 546 days in 2015/16 and 518 days now (2019/20). Note that if the price doubles from last week’s bottom (6500), as it happened is 2016 2 weeks before the Halving, we will reach 13000 which is roughly the June Top.
This justifies 100% my original September 22th idea of a prolonged consolidation within the 2nd Accumulation phase and the current analysis shows that almost a full year of consolidation in 2020 is certainly possible.
Coincidence or not, Bitcoin has an uncanny consistency at repeating cyclical patterns. Will it happen this time around? I say there are indeed more probabilities on its favor. But what do you think? Will 2020 be the year of Recovery and Accumulation? Let me know in the comments section!
Please like, subscribe and share your ideas and charts with the community!
Tradingview link: