
-
BITCOIN marching to the 1W MA20 with the LMACD turning BULLISH!
- April 24, 2020
- Posted by: Tradingshot Articles
- Category: Cryptocurrency
No Comments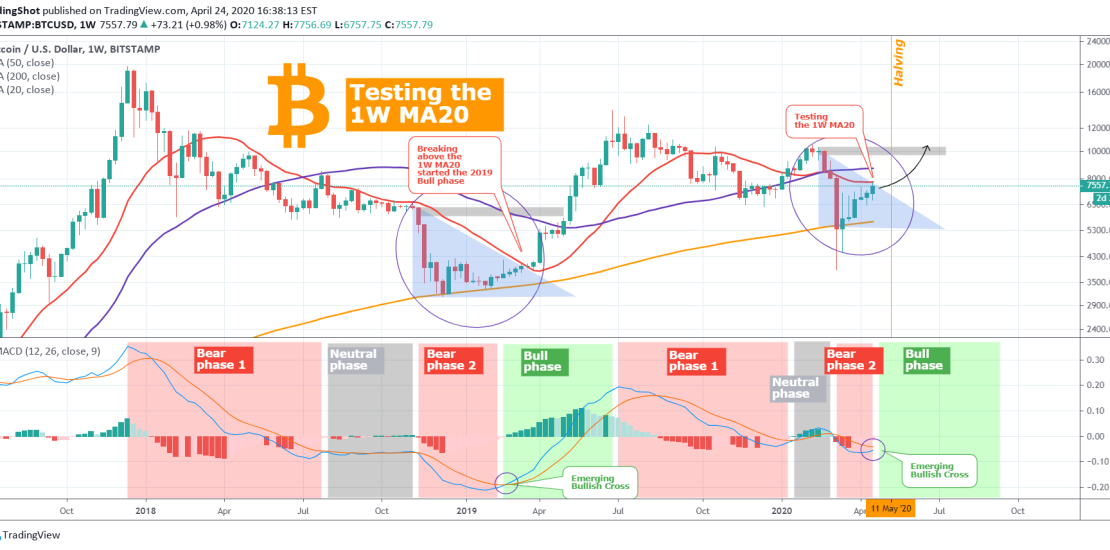
The title is descriptive enough as it is. Bitcoin is posting a fair run this week and is testing the 1W MA20 (red trend-line on the chart). At the same time the LMACD (which for those who follow me know it has been a very reliable indicator) is about to make a bullish cross.
-
BITCOIN The BEST BUY SIGNAL we will ever get.
- April 15, 2020
- Posted by: Tradingshot Articles
- Category: Cryptocurrency
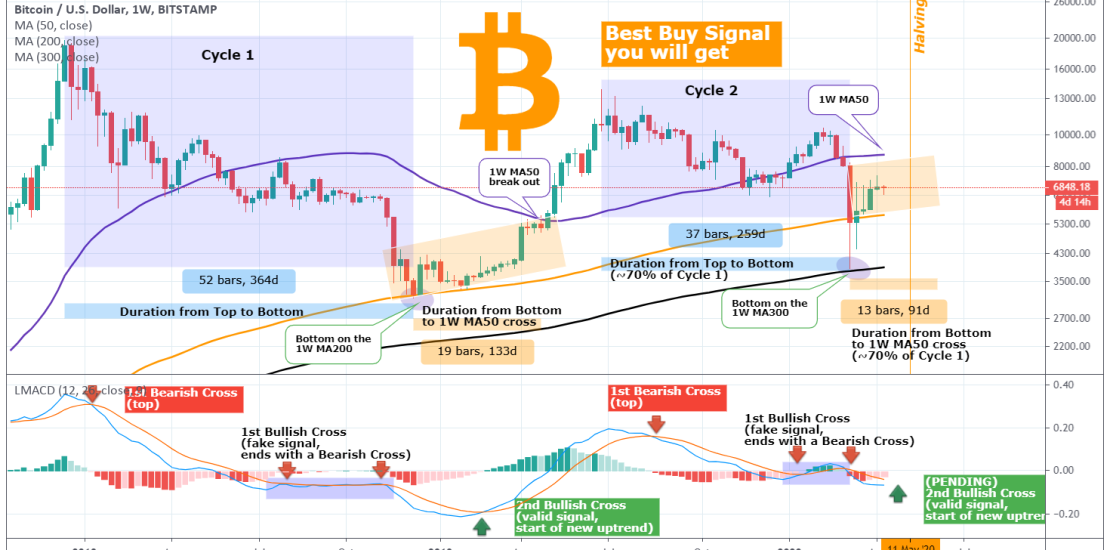
** Cycle 1 vs Cycle 2 ** If this consolidation is extended then we may have a similar pattern as in January – March 2019 (the subject I’ve been discussing for a long time). Since the two mini Cycles (December 2017 – April 2019: Cycle 1 and June 2019 – date: Cycle 2) are
-
BITCOIN Testing the 1D MA50. An RSI Fractal & Fibonacci analysis
- April 9, 2020
- Posted by: Tradingshot Articles
- Category: Cryptocurrency
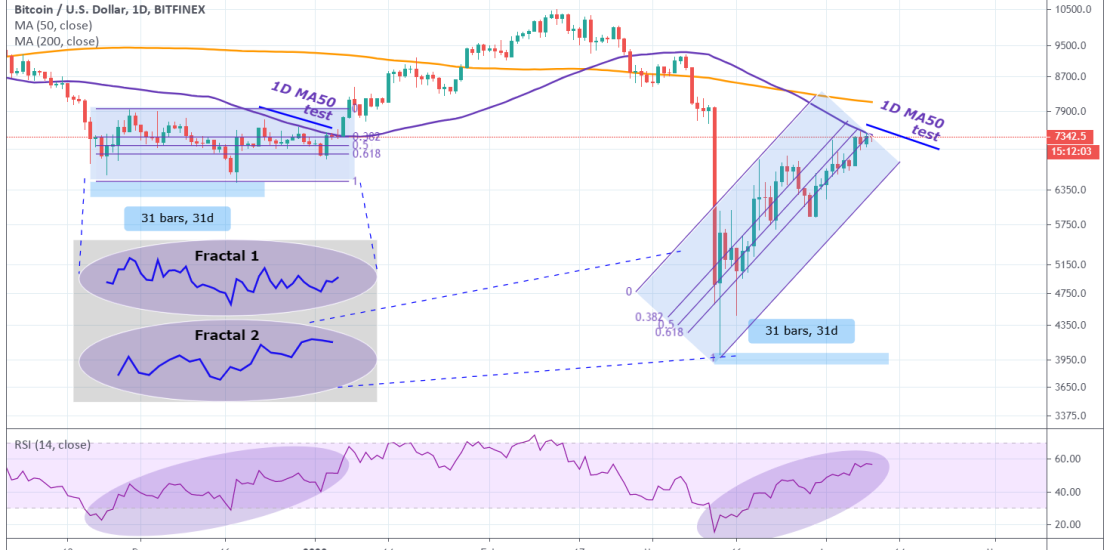
Everyone is talking about Bitcoin testing the 1D MA50 and deservedly so as it is a critical test in order to sustain the current uptrend. Before we start please support this idea with your likes and comments, it is the best way to keep it relevant and support me. ** The RSI ** To begin
-
BITCOIN’s most important test of the year can lead to $10500
- April 6, 2020
- Posted by: Tradingshot Articles
- Category: Cryptocurrency
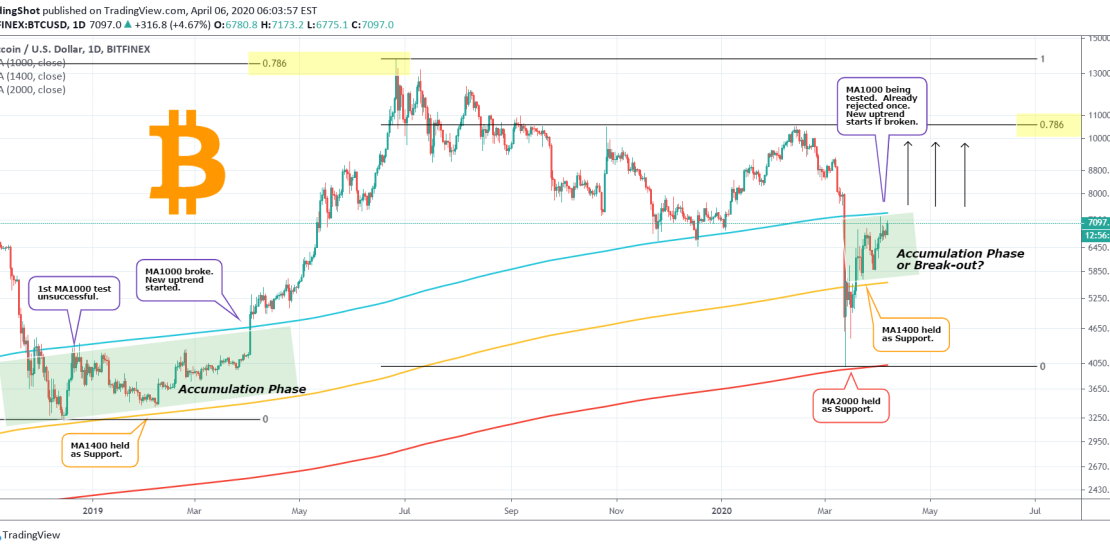
Before we start please support this idea with your likes and comments, it is the best way to keep it relevant and support me. Last week Bitcoin made a new high, while almost completing three straight green closings on 1W candles. This is certainly a bullish signal, having also reached the 0.618 Fibonacci retracement
-
BITCOIN is exactly where it should be.
- March 28, 2020
- Posted by: Tradingshot Articles
- Category: Cryptocurrency
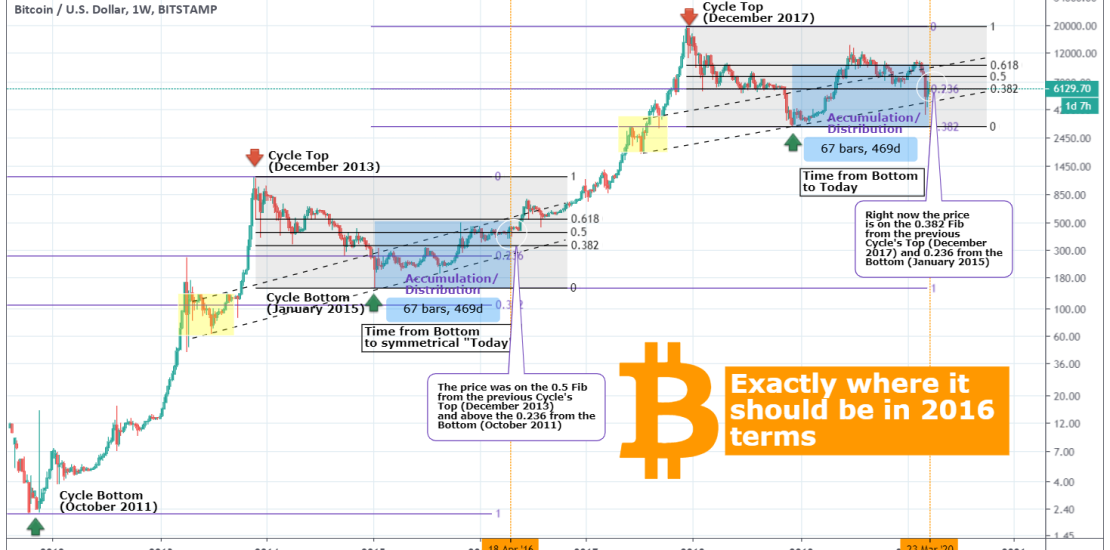
We are currently more than 450 days since the bottom of the previous Bear Cycle in December 2018. Despite the 13800 peak last June (2019), Bitcoin’s continuous and most recently more aggressive correction has got the crypto world worried that we are diverging from the long term bullish trend. But should we be that worried?
-
BITCOIN The 50%/60% Higher High Rule. Get ready for $20000!
- March 25, 2020
- Posted by: Tradingshot Articles
- Category: Cryptocurrency
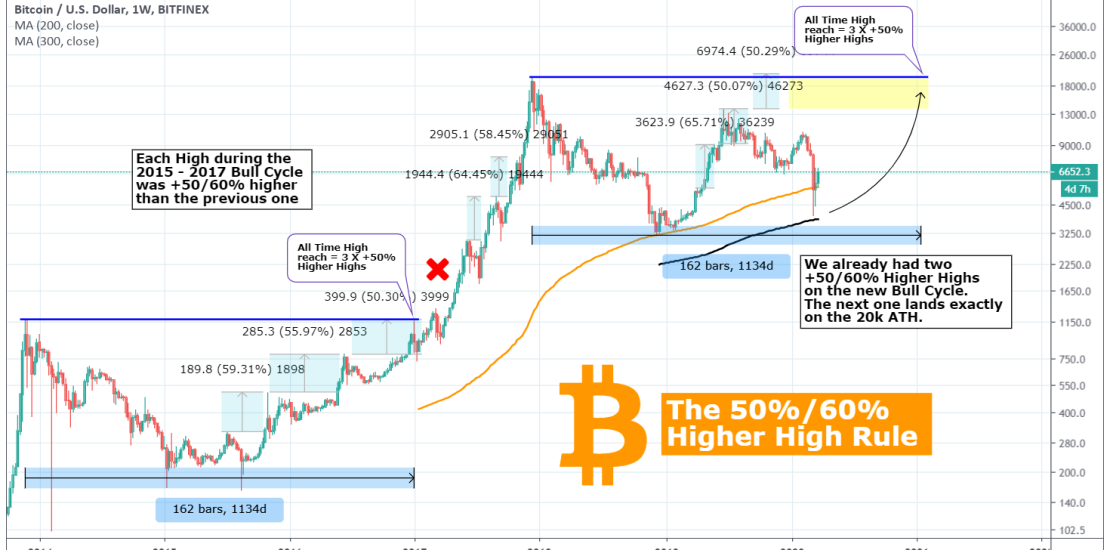
Ignore the recent sell-off caused by the “Coronavirus liquidation effect” across all non-liquid asset classes. Bitcoin found support on the 1W MA300 (black line) and rebounded. Most likely we will be viewing this in the future as “non-technical noise” as Bitcoin continues to make Bull Cycle after Bull Cycle and new All Time Highs.
-
BITCOIN Back into the Buy Zone. The importance of 1D MA1000/1400
- March 20, 2020
- Posted by: Tradingshot Articles
- Category: Cryptocurrency
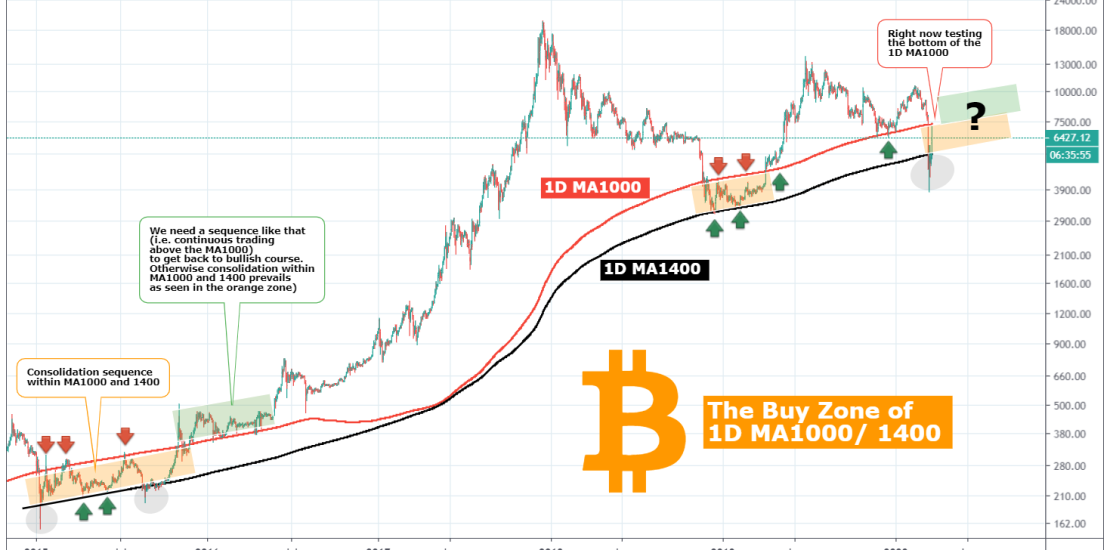
Not even 1 week passed since my article on the 1W MA300 and why that bounce (and the candle’s wick) could be key for Bitcoin’s future. The Buy Zone which on the 1W chart consisted of the MA200 and MA300, on the 1D chart is made of the MA1000 (red trend line) and the
-
LTCBTC Maybe ahead of a big sell-off
- March 16, 2020
- Posted by: Tradingshot Articles
- Category: Cryptocurrency
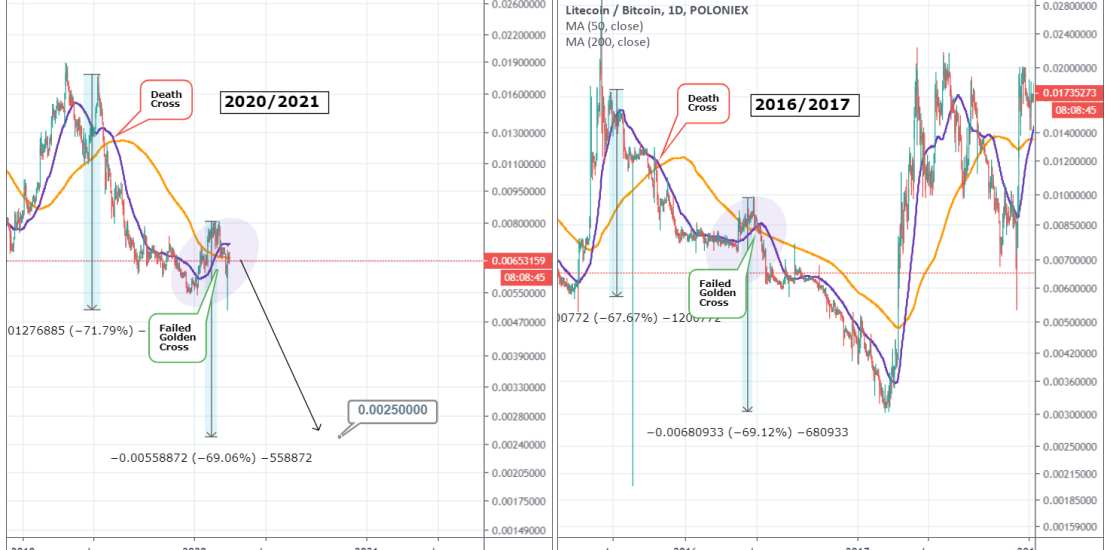
Nothing fancy here just a simple comparison of the recent price action with June 2016, when LTCBTC also nose dived after a failed Golden Cross on the 1D chart. The result then was a nearly -70% drop. If the pattern is repeated then the price can decline as low as 0.0025. Tradingview link: https://www.tradingview.com/chart/LTCBTC/gjeqg3TL-LTCBTC-Maybe-ahead-of-a-big-sell-off
-
BITCOIN The day it became fully correlated with S&P500
- March 14, 2020
- Posted by: Tradingshot Articles
- Category: Cryptocurrency
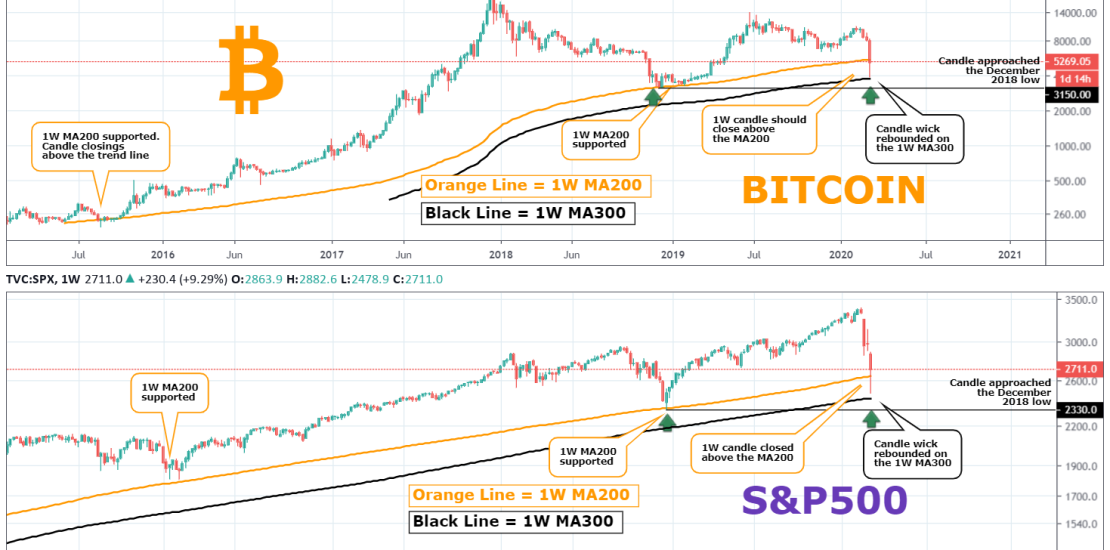
With this title you might be wondering what Bitcoin has to do with the Standard & Poor’s 500 (S&P500) stock index. You think that Bitcoin and stocks are not correlated? Think again as there is a correlation and indeed a very scary one. Basically I should rephrase the title to “The WEEK it became fully
-
LTCETH Sell Signal
- March 13, 2020
- Posted by: Tradingshot Articles
- Category: Cryptocurrency
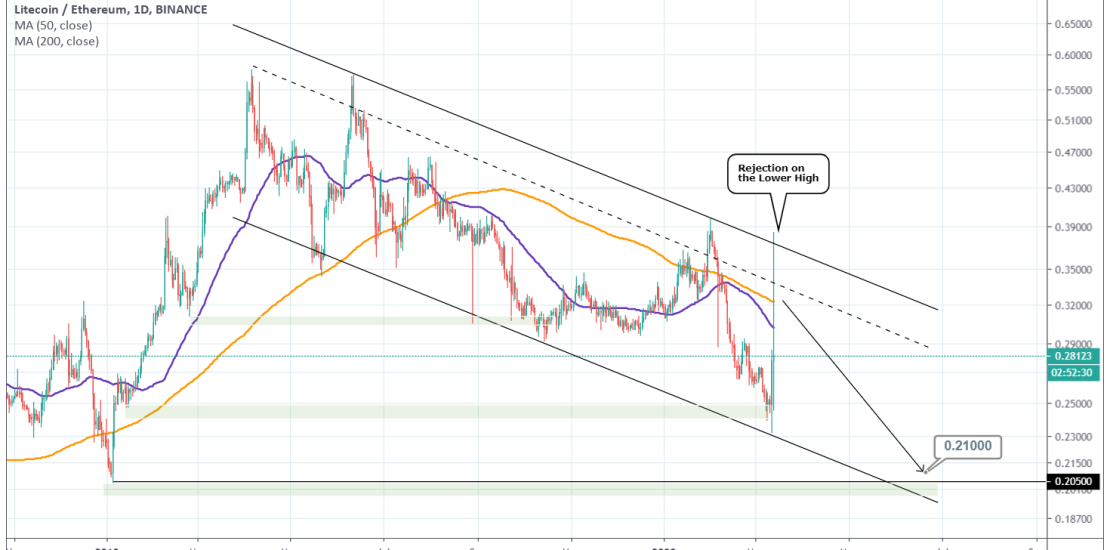
Pattern: Channel Down. Signal: Bearish as the price was rejected on the Lower High trend line of the pattern: Target: 0.2100 (right above the symmetrical Gap fill (green line)). Tradingview link: https://www.tradingview.com/chart/LTCETH/mw4oiGDn-LTCETH-Sell-Signal
