

- March 14, 2020
- Posted by: Tradingshot Articles
- Category: Cryptocurrency
With this title you might be wondering what Bitcoin has to do with the Standard & Poor’s 500 (S&P500) stock index. You think that Bitcoin and stocks are not correlated? Think again as there is a correlation and indeed a very scary one.
Basically I should rephrase the title to “The WEEK it became fully correlated” as I am looking at this week’s sell-off that took the cryptocurrency world (and not only) by storm and, as I will show you, has EVERYTHING to do with the panic selling on the stock markets. Circuit breakers, national emergencies and a ton of other panic headlines that have been hitting the news, the effect of the Coronavirus was largely underestimated by most of us. It really goes to show how the real economy and the cryptospace are two pieces of the same mechanism.
On this study I will bring forward a scary correlation of Bitcoin and S&P500 that I came across while using the moving averages. The result is striking and I am sure will leave many shocked at how similar the price action of the two financial assets has been all along and was always there but couldn’t see it.
** The 1W MA200 and MA300 **
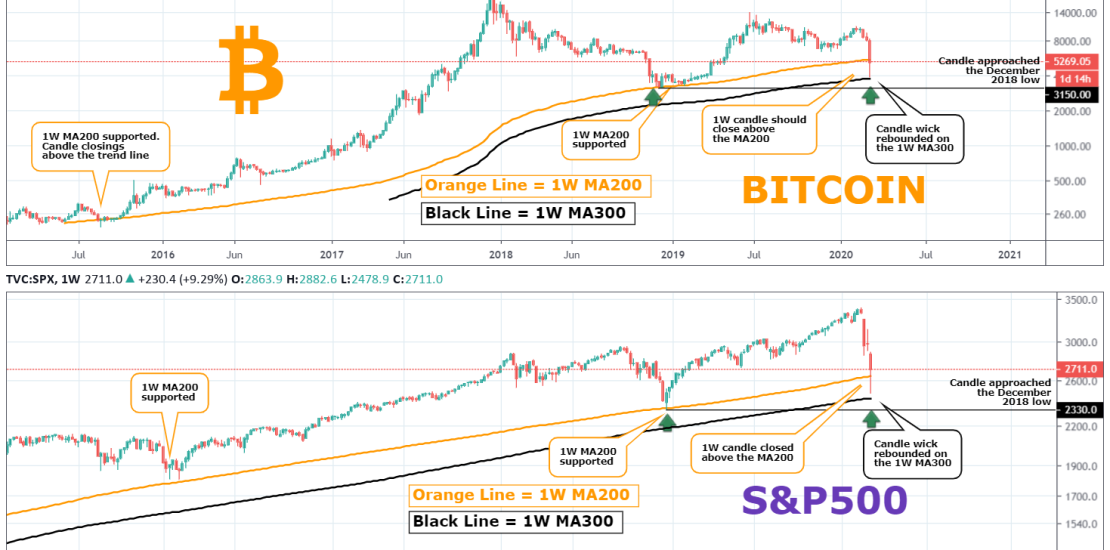
First of all let me begin by saying that the use of the 1W chart is best suited for this kind of comparison as it allows to go a few years back in the timeline and stretch the Moving Averages. I am using the 1W MA200 (displayed in orange) and 1W MA300 (black trendline) which reveal the following:
– The MA200 has been providing support to both BTCUSD and S&P500 (for S&P in the last ten years for BTC as far as the trend line goes). As you can see on the chart, it supported BTC in mid 2015 on a multi-month span while S&P in Jan/Feb 2016. Then things get really interesting as the trendline made contact with both BTC and S&P on the exact same times: the December 2018 lows and now on the current weekly candle, which of course as we know broke through. The key however on this move is this: for S&P the candle’s wick retraced back above the MA200 and closed the candle above it. We have seen in 2015 that when that happened on Bitcoin (1W candle closing above the MA200), the downfall was contained and gradually started building an uptrend. It is therefore important to see the current 1W candle close above the MA200 now.
– The MA300 is the level where this week’s candle both on BTC and S&P found Support. This goes to show just how correlated the two have become during this time of crisis. The price almost hit the MA300 level and rebounded making that long wick, which on S&P closed above the MA200 and on Bitcoin it remains to be seen. It needs to be said that the MA300 has never been touched on Bitcoin while on S&P500 the last contact was in December 2011.
** Approaching the December 2018 low on both **
Another interesting development is that the current sell-off has come to close to the December 2018 lows both on BTC and S&P. Almost causing a Double Bottom formation. Double Bottoms are considered to be bullish patterns but of course that remains to be seen. It would be much better for both just to sustain trading above the 1W MA200/300 zone.
** Do not hope for a new recession **
As a conclusion I would like to point out that the above similarities show that Cryptocurrency is as real of a financial asset as anything in this world and people (especially under times of panic, geopolitical unrest and other crises) treat it as such. Human psychology in states of fear (or equally euphoria) is identical both when trading stocks and cryptocurrency alike. And the more institutionalized Bitcoin gets, the more often we will see it correlating to Wall Street behavior. I think Bitcoin buyers learned this week that expecting a new global recession and meltdown of the financial system in hopes that it will boost Bitcoin’s price, won’t do any good. Bitcoin has of course the capacity to outperform S&P500 and any other traditional asset in the coming years, but will be affected just as much by a global recession as investors will be liquidating their assets in fear.
I hope you enjoyed this comparative analysis and helped you put this week’s sell-off into perspective. But what do you think? Do you believe this correlation can serve as a benchmark on how we should be treating Bitcoin like in future crisis events or you believe it is only a temporary similarity? Let me know in the comments section!
Please like, subscribe and share your ideas and charts with the community!
Tradingview link: