

- April 9, 2020
- Posted by: Tradingshot Articles
- Category: Cryptocurrency
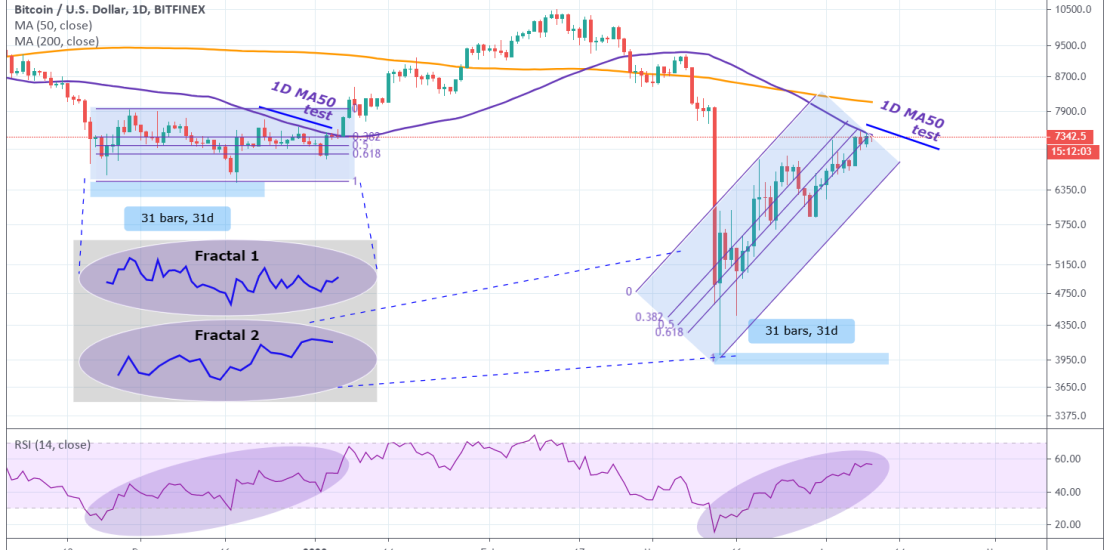
Everyone is talking about Bitcoin testing the 1D MA50 and deservedly so as it is a critical test in order to sustain the current uptrend.
Before we start please support this idea with your likes and comments, it is the best way to keep it relevant and support me.
** The RSI **
To begin with, I will draw your attention to the basis on this study which is the RSI. As you see the RSI sequence of November 23 – December 23 2019 (Fractal 1) is similar to the current one after the March 13, 2020 bottom (Fractal 2).
** Fractals **
What is even more interesting is that the candle sequence since the March 13 bottom (Fractal 1) even though it is much steeper that Nov- Dec, 2019 (Fractal 1), they are virtually identical fractals on a line mode.
** Fibonacci on log and Fibonacci Channel **
It is also interesting to see that both Fractals are trading around the same Fibonacci levels: Fractal 1 is on the traditional logarithmic Fibonacci while Fractal 2 due to its ascending pattern, is on the Fibonacci Channel.
In conclusion, if the 1D MA50 breaks now, then based on Fractal 1, BTC should extend its rise to the MA200 (which is not far off anyway) and even go as far as closing the March gap. If the 1D MA50 is rejected though, we may have an extended Accumulation Phase as described on the idea below:

How important do you think the 1D MA50 is? Feel free to share your work and let me know in the comments section!
Please like, subscribe and share your ideas and charts with the community!
Tradingview link: