

- April 24, 2020
- Posted by: Tradingshot Articles
- Category: Cryptocurrency
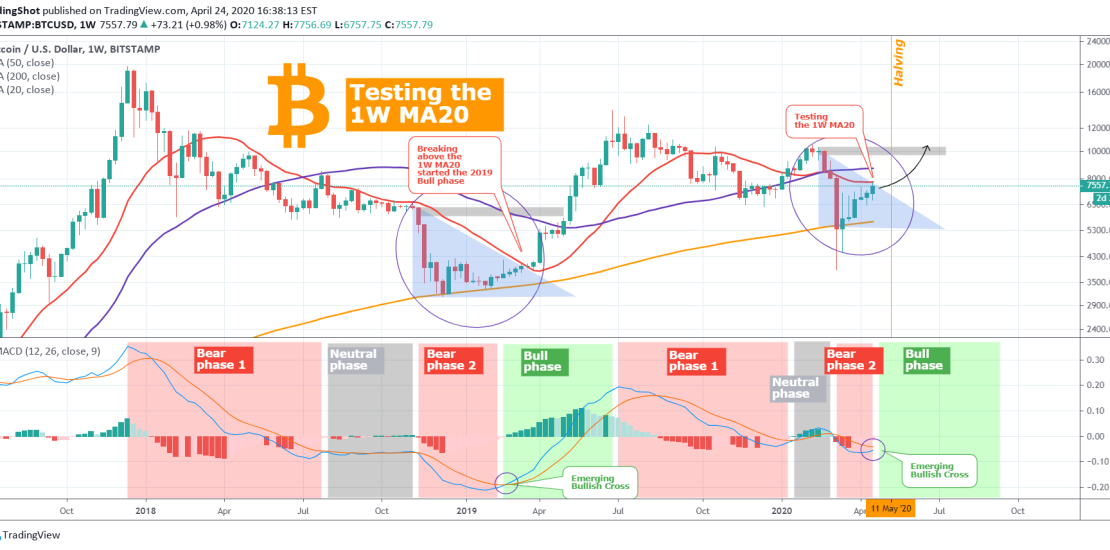
The title is descriptive enough as it is. Bitcoin is posting a fair run this week and is testing the 1W MA20 (red trend-line on the chart). At the same time the LMACD (which for those who follow me know it has been a very reliable indicator) is about to make a bullish cross.
** Before we start please support this idea with your likes and comments, it is the best way to keep it relevant and support me. **
** Why is the 1W MA20 so important **
It is a valid question and the essence of this study. The 1W MA20 is such an important level because every time the price broke above it, an uptrend followed. Last time it did on January 13th 2020, the price was at $8300 and the uptrend that followed peaked at $10500. Minor uptrend but uptrend nonetheless. The previous time Bitcoin broke above the 1W MA20 though was a bigger one. That was in March 18th 2019 with the price at $5500 and the uptrend that followed peaked at $13900.
** How Bitcoin got to the 1W MA20 **
Two weeks ago I posted the chart below, explaining the importance of the 1D MA50 and how a break out could start a bullish sequence:

This week Bitcoin succeeded at breaking this first very important 1D MA50 barrier. Next is the Lower High trend-line, a subject I reviewed on the idea below:

On a smaller time-frame, BTC has simply respected the Fibonacci Channel I posted earlier this week and is replicating the recurring pattern (A-G) we discussed as seen below:

** Comparison with March 2019 **
Now let’s come back to today. I believe a comparison with the previous break out (March 2019) would be more fair and technically sound though for 3 reasons.
– First, because the 1W MA20, 50, 200 set-up is aligned in a similar way. The price has been keeping the MA200 as a Support for several weeks, with the MA20 acting as the 1st Resistance level and the MA50 as the 2nd.
– Second, because of the LMACD which is replicating the same phases as during the 2018/early 2019 Bear Cycle.
** The LMACD phases **
As you see on the chart the 2018/ early 2019 Bear Cycle is identical in terms of the LMACD with the mini-Cycle following the June 2019 peak. The phases are easily classified into Bear, Neutral and Bull. Right now we are on the 2nd Bear phase and the LMACD is about to make a Bullish Cross into the Bull phase, exactly what took place in February 2019, a month before the break-out above the 1W MA20!
This means that we could have roughly another month before we break convincingly above the 1W MA20? Could be especially if you think that this is roughly when we will get the Halving. Regardless of that, this is a strong bullish long-term sequence building up and barrier after barrier is being broken. Noticeably, when the price crossed above the 1W MA20 in March 2019, it took Bitcoin roughly 1.5 month to fill the gap of the sell-off.
Do you agree that the 1W MA20 is such an important level? Do you think that a break-out will lead to another rally? Feel free to share your work and let me know in the comments section!
Please like, subscribe and share your ideas and charts with the community!
Tradingview link: