- March 28, 2020
- Posted by: Tradingshot Articles
- Category: Cryptocurrency

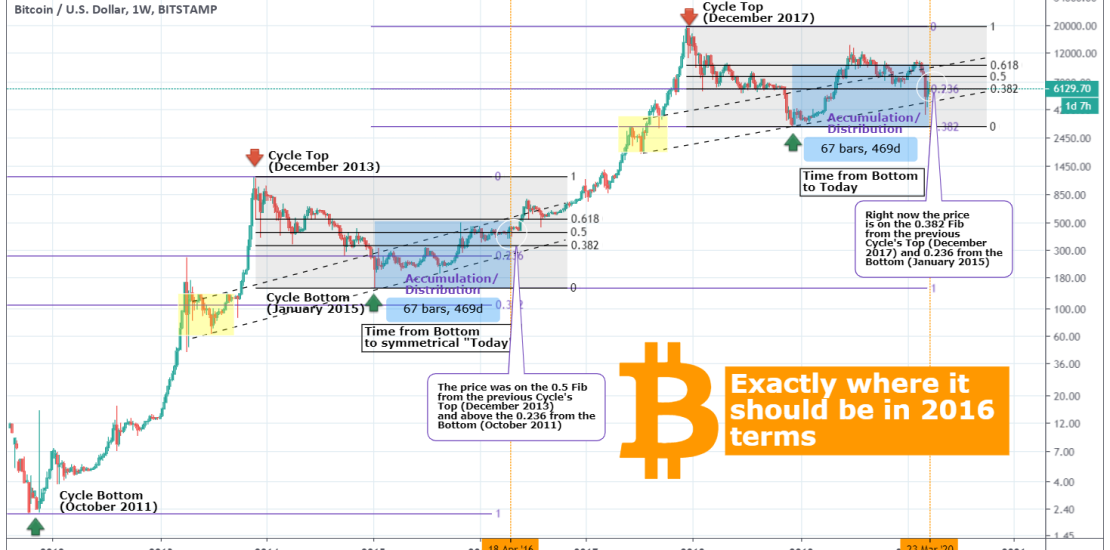
We are currently more than 450 days since the bottom of the previous Bear Cycle in December 2018. Despite the 13800 peak last June (2019), Bitcoin’s continuous and most recently more aggressive correction has got the crypto world worried that we are diverging from the long term bullish trend. But should we be that worried?
** Comparison with the 2016 Cycle **
At the moment the price is on the 0.382 Fibonacci retracement level from the previous Cycle’s Top (December 2017) and 0.236 from its Bottom (January 2015). If we go back to the same day during the previous Cycle (i.e. +450 days from the January 2015 bottom), we will see that the price was on the 0.5 Fib from the previous Cycle’s Top (December 2013) and above the 0.236 from its Bottom (October 2011). This means that at the moment Bitcoin is more or less at the same spot where the price was during the 2016 Cycle. Which means that the general bullish trend hasn’t changed and we remain on optimal buy levels. In fact if it wasn’t for the recent Wall Street fueled “COVID crash”, the price would be exactly on the 0.5 Fibonacci.
** The Mini Growth Channel **
During 2015/2016, the price was having a smoother, gradual rise from its Cycle Bottom until roughly after the Halving (what I call as the Accumulation/ Distribution phase) when it really turned parabolic. It was based on a Channel Up (on the log scale of course) with clear Higher Lows and Higher Highs. The parallel lines of this Channel have starting base on the last volatility zone before the Cycle’s Top (marked with the yellow Rectangle on the chart). On the current Cycle, Bitcoin is trading in the middle of its respective 2019/2020 “Mini Growth Channel”.
In conclusion I believe that all markers show that we have not diverged from the bigger, historic bullish trend and just as the 13800 June peak was an anomaly (speculation over wider acceptance, Libra etc), the recent “COVID crash” was as well. If we never had those events, Bitcoin would have had a smooth rise within its Mini Growth Channel just as its did in 2015/2016. Even if we had currently a slightly lower reading in Fibonacci terms, we would still be on track with BTC’s historic parabolic growth as the lengthening cycle’s show diminishing returns in the future (this is a theory I have explained extensively in the past but if you like I can make a new analysis, just ask me to in the comments section).
Do you agree with this comparison? Feel free to share your work and let me know in the comments section!
Please like, subscribe and share your ideas and charts with the community!
Tradingview link:
https://www.tradingview.com/chart/BTCUSD/TSIzliJ6-BITCOIN-is-exactly-where-it-should-be

