
-
BITCOIN Testing the ATH with Production Cost near. Sign for 50k?
- December 4, 2020
- Posted by: Tradingshot Articles
- Category: Cryptocurrency
No Comments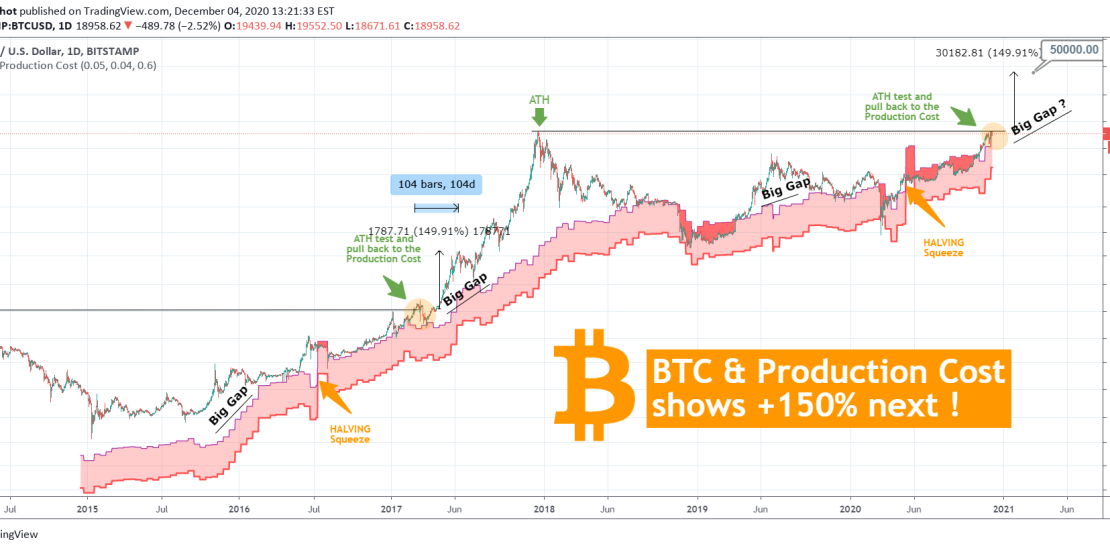
Bitcoin has been consolidating since December 01 when it touched the All Time High (19900 of Dec 2017). On any other occasions, consolidation on such a key Resistance level would be a sign of struggle, hence a bearish signal. However in this study I examine why this may not be the case based on
-
Is this the start of the parabolic run for LITECOIN?
- November 20, 2020
- Posted by: Tradingshot Articles
- Category: Cryptocurrency
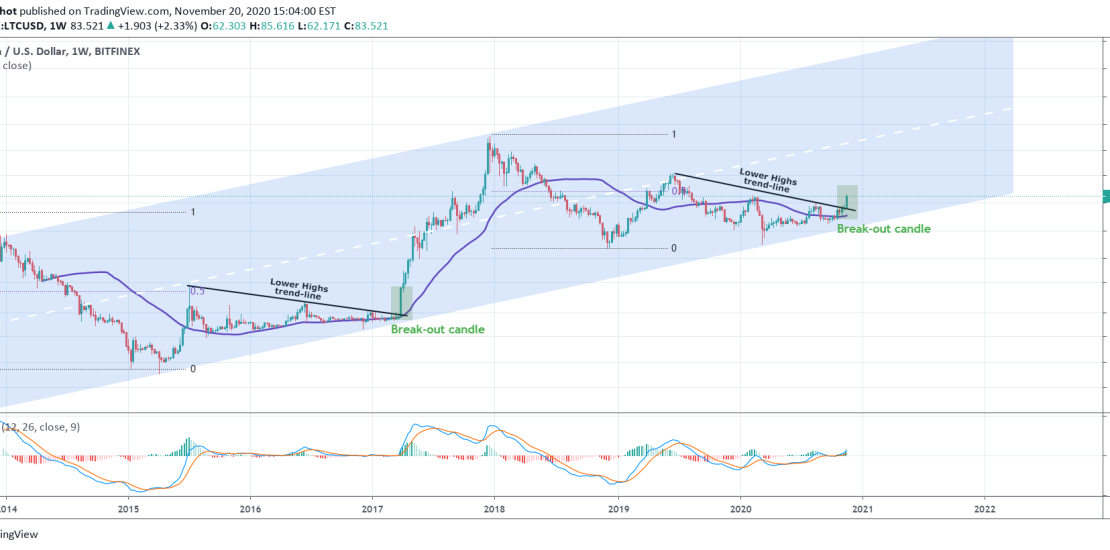
This is a simple comparison on LTCUSD of the current cycle with the previous. As seen on the chart, on March 2017, Litecoin broke above the accumulation sequence that was contained under a Lower Highs trend-line and that 1W candle was what kick-started its parabolic Bull Run. Right now the situation is exactly the
-
BITCOIN The Hyperbola & Pitchfork break can end the year at 20k!
- November 10, 2020
- Posted by: Tradingshot Articles
- Category: Cryptocurrency
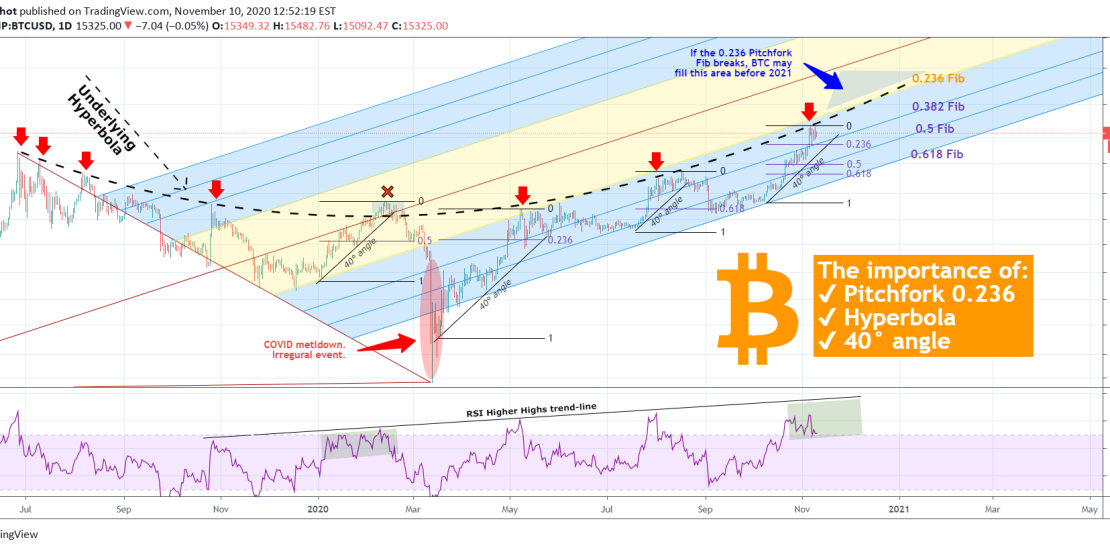
This study focuses on two very important underlying dynamics that have been dictating Bitcoin’s price action for the past 1.5 year: The Pitchfork and the Hyperbola. This comes at a time when Bitcoin is consolidating after a 1 month rally that broke above the $13865 High of June 26, 2019. So it is natural
-
BITCOIN The Fibonacci/MA combo shows a rocket is about to start!
- November 4, 2020
- Posted by: Tradingshot Articles
- Category: Cryptocurrency
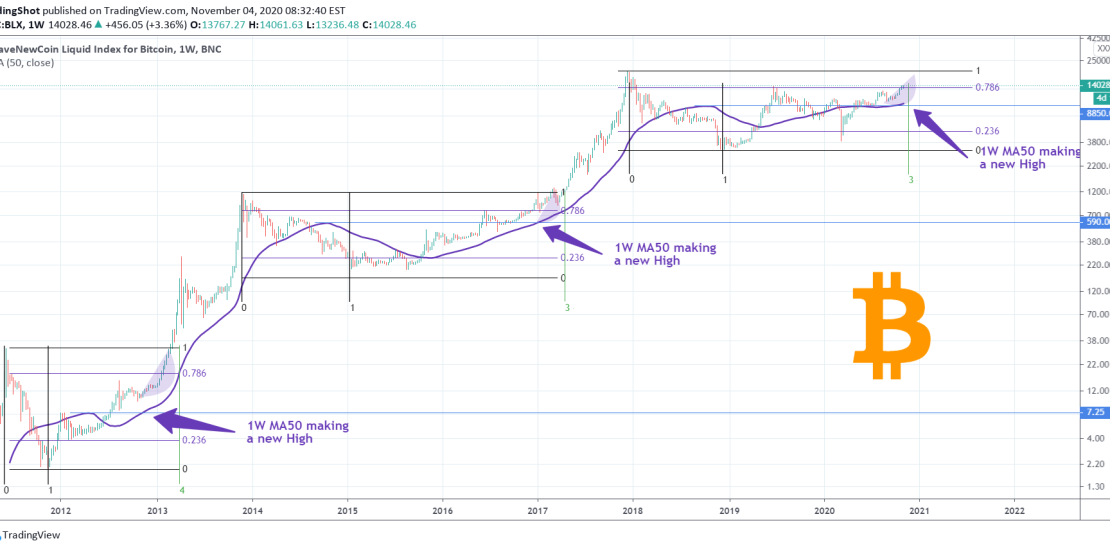
I will keep this simple and short. Every two simple parameters are filled, Bitcoin starts a parabolic bull run. Those are the MA50 making a new High on the 1W time-frame and trading above the 0.786 Fibonacci retracement level. That happened at least back in late 2012 and 2016. On present day, two weeks
-
BITCOIN Why a break above $13865 can deliver a “Santa Rally”
- October 30, 2020
- Posted by: Tradingshot Articles
- Category: Cryptocurrency
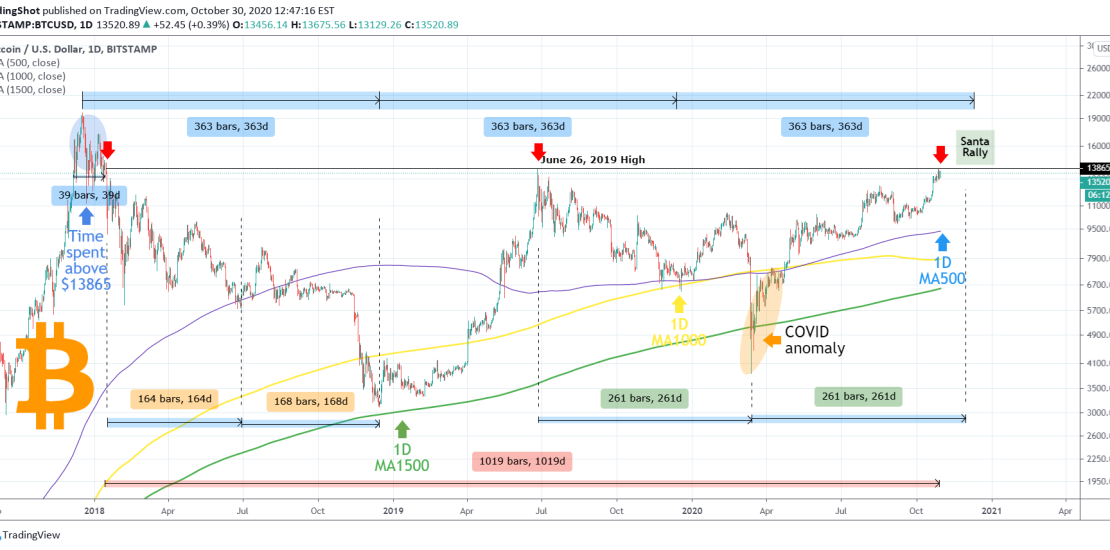
This study revolves around the importance of the $13865 level. This is of course what is known to most as the June 26, 2019 High and current Resistance for Bitcoin’s uptrend. I show on this idea why this level is more than just a Resistance. ** Only 39 days above 13865 ever! ** First
-
GOLD to BITCOIN ratio. Are gold investors switching back to BTC
- October 30, 2020
- Posted by: Tradingshot Articles
- Category: Cryptocurrency
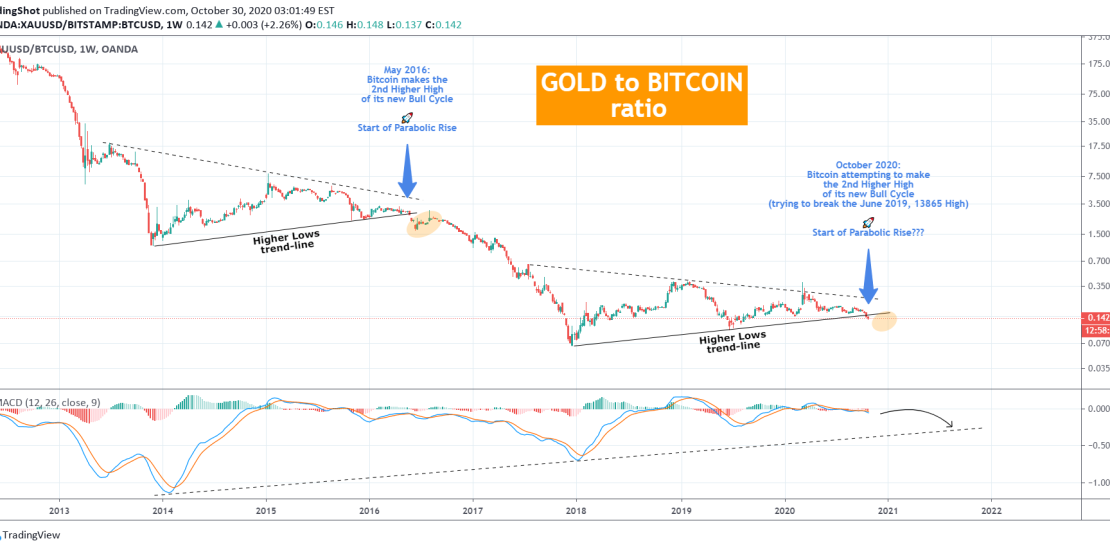
I have used the Gold-to-BTC ratio many times in my publications, one of the most informative of those seen below: I looked into it again as lately I am seeing an interesting price action between the two. While Gold struggles to regain its bullish momentum of the early part of the year, Bitcoin touched
-
TEZOS (XTZUSD) Buy Signal
- October 29, 2020
- Posted by: Tradingshot Articles
- Category: Cryptocurrency
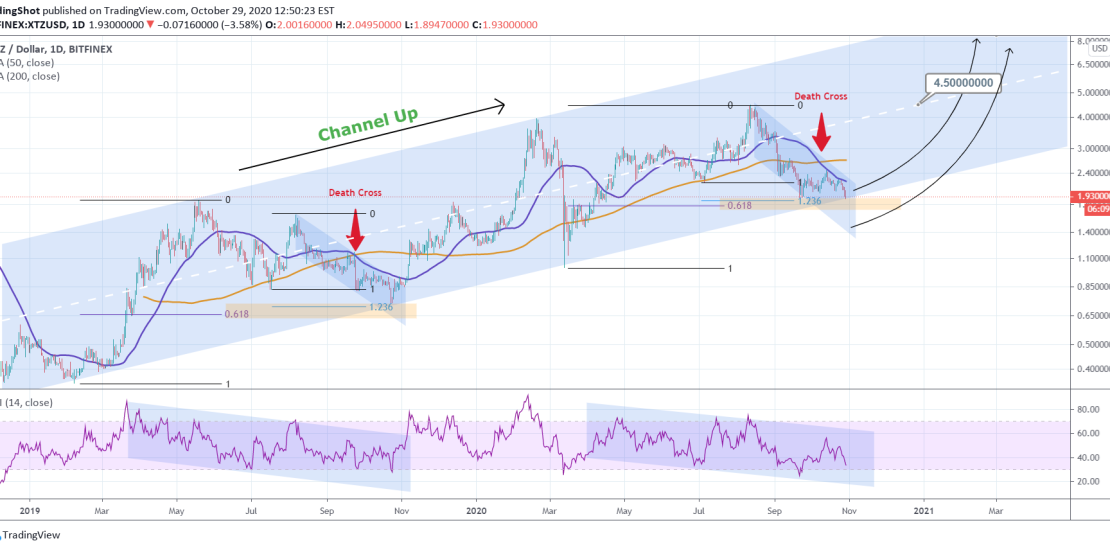
Pattern: Channel Up on 1D. Signal: Buy as the price is testing the Higher Low trend-line of the Channel, following a Death Cross, being on the 0.618/ 1.236 Fib aggregate that previously was a buy zone. Target: 4.500 (Resistance) and in extension 8.500 (Higher High of the Channel Up) TA very successful on previous
-
Bitcoin and U.S. elections. What does the past tell us?
- October 26, 2020
- Posted by: Tradingshot Articles
- Category: Cryptocurrency
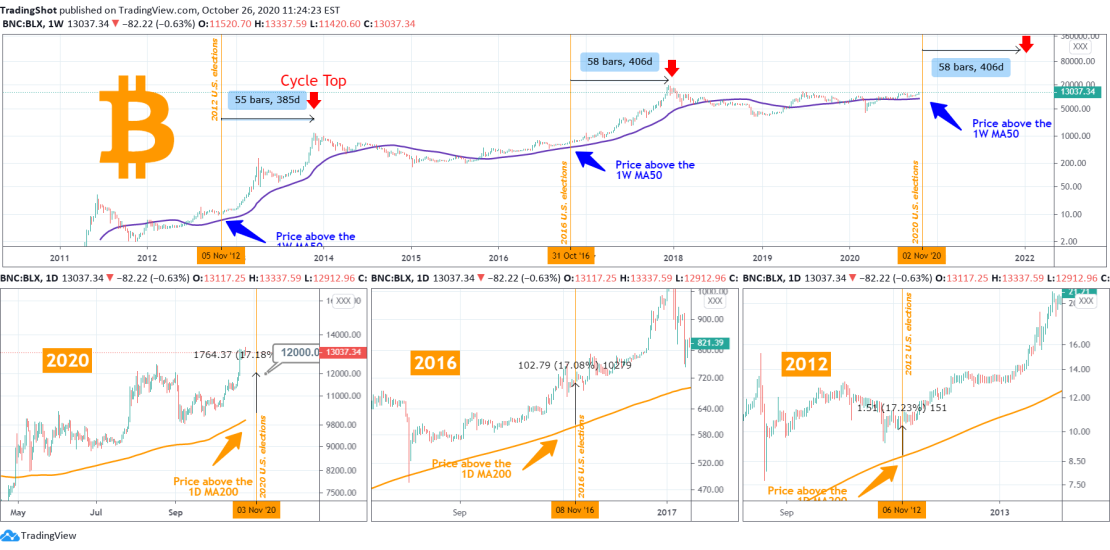
Undoubtedly the most important event of the upcoming week are the U.S. Presidential elections. We have seen in the past the high impact that the result has on the financial markets and Bitcoin is no exception, especially in late years where it is more correlated with the stock market than ever before. So how
-
ETHEREUM on the weekly chart. Is $600 achievable?
- October 23, 2020
- Posted by: Tradingshot Articles
- Category: Cryptocurrency
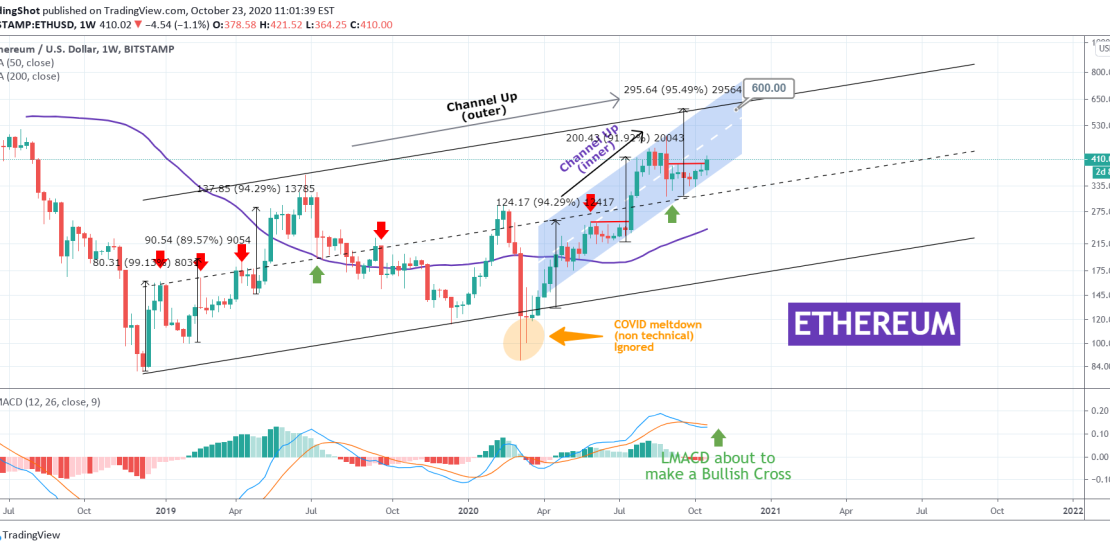
Last week I posted the following chart on Ethereum: ** The Inner Channel Up ** It was about the final Resistance level of 400 that ETH had to break before its April Channel Up (inner/ blue) on the 1D chart turned bullish again. Well it happened, as the 1D MA50 turned into Support, and
-
BITCOIN testing the Underlying Trendline again. $14300 possible?
- October 20, 2020
- Posted by: Tradingshot Articles
- Category: Cryptocurrency
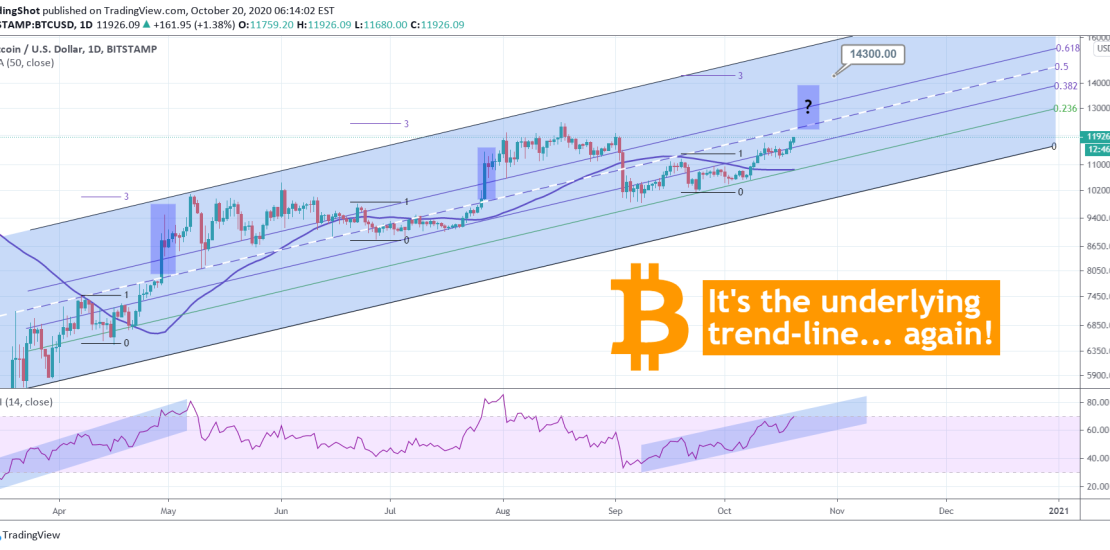
So Bitcoin has started to show some activity again. Do you remember the ‘Underlying Trend-line’ which I initially published in June and revised in July? At that time, I called it “the most consistent trend-line since March”: Guess what. Not only does it still remain relevant to this day but also BTC is testing
