

- November 10, 2020
- Posted by: Tradingshot Articles
- Category: Cryptocurrency
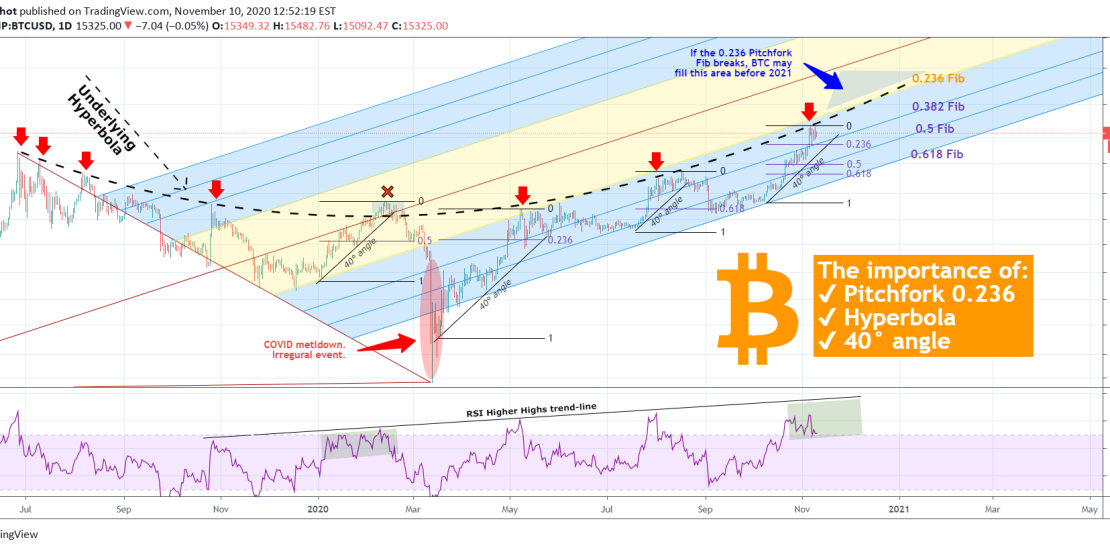
This study focuses on two very important underlying dynamics that have been dictating Bitcoin’s price action for the past 1.5 year: The Pitchfork and the Hyperbola.
This comes at a time when Bitcoin is consolidating after a 1 month rally that broke above the $13865 High of June 26, 2019. So it is natural for traders and long-term investors alike to be in search for new clues that can give a meaningful projection on what’s next.
** The Pitchfork **
I would like to begin with the Pitchfork tool from the June 2019 High – March 2020 Bottom. As you see on the chart, the 0.382 – 0.618 Fibonacci levels (blue zones) are forming essentially (what I’ve talked numerous times about since March), the dominant Channel Up on the 1D time-frame, that has took BTC from the lows on the March crash through a sustainable growth that just reached the Highs of today.
The 0.236 Fib (orange line) appears to be the Resistance and is the level that BTC currently got rejected on.
** The Hyperbola **
This rejection not only happened on the 0.236 Pitchfork Fib but also on the Hyperbolic pattern that started from the June High and seems to be the ‘Underlying’ Resistance trend-line all this time, with 7 successful rejections (red arrows) and only 1 (very marginal) breach (x noted on the chart).
** The 40° angle **
Every contact with that Hyperbola (even the marginal miss) ended up with a pull-back that ranges from the 0.236 Fib to as low as 0.618 Fib (not counting the March 07 – 12 COVID meltdown which is non-technical). The trend-line we need to keep an eye on the the 40° angle from each bottom. When this breaks, the price pulls back. This can take place above the Hyperbola and the 0.236 Pitchfork Fib, so be ready to apply it.
** The RSI Higher Highs trend-line **
An indicator that shows that the top can be formed this time above the 0.236 Pitch Fib for the first time since mid February, is the RSI. Since October 2019, it is on a Higher Highs pattern which has currently hasn’t been filled. I get the impression that if the 0.236 Fib breaks, the RSI has enough strength to allow a move to the ATH ($20000) before the start of 2021. An extension of the ‘Santa Rally’ I talked about a few weeks back.
What do you think it is going to be? Are the Hyperbola and 0.236 Pitchfork Fib going to work again in sellers favor on the short-term or it is time for BTCUSD to break above them and test 20k? Feel free to share your work and let me know in the comments section!
Please like, subscribe and share your ideas and charts with the community!
——————————————————————————————————–
!! Donations via TradingView coins also help me a great deal at posting more free trading content and signals here !!
🎉 👍 Shout-out to TradingShot’s 💰 top TradingView Coin donor 💰 this week ==> TradingView
——————————————————————————————————–
Tradingview link: