

- October 20, 2020
- Posted by: Tradingshot Articles
- Category: Cryptocurrency
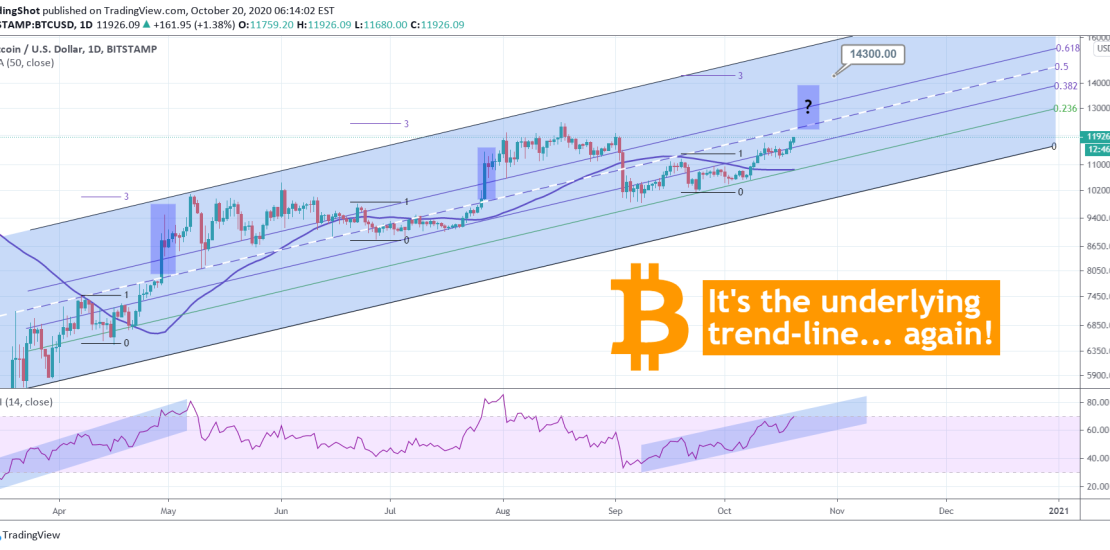
So Bitcoin has started to show some activity again. Do you remember the ‘Underlying Trend-line’ which I initially published in June and revised in July? At that time, I called it “the most consistent trend-line since March”:

Guess what. Not only does it still remain relevant to this day but also BTC is testing it again right now. This line is displayed by the white dashed line on this chart. As you see every time the price breaks above it, a very strong daily rally follows. As back in April, BTC has again formed a Channel Up on its 1D RSI, which represents accumulation on the actual price action. It is probably a matter of time before this breaks upwards.
An important parameter of this price action within the Channel Up, is that if we take the 3.000 Fibonacci extension from the 3rd High after the previous top, it gives us the next Top. If that feature stays valid this time also, then we are looking at a next Top around $14300.
What do you think? Is it worth buying now for roughly a $14k target? Feel free to share your work and let me know in the comments section!
Please like, subscribe and share your ideas and charts with the community!
——————————————————————————————————–
!! Donations via TradingView coins also help me a great deal at posting more free trading content and signals here !!
🎉 👍 Shout-out to TradingShot’s 💰 top TradingView Coin donor 💰 this week ==> TradingView
——————————————————————————————————–
BONUS MATERIAL. It is not the first time this trend-line and fractals within this Channel Up, provide the framework for very accurate projections. Take a look below:


